. 2015 Oct;39(10):1917-29.
doi: 10.1111/acer.12834. Epub 2015 Sep 2.

Chronic Alcohol Exposure and the Circadian Clock Mutation Exert Tissue-Specific Effects on Gene Expression in Mouse Hippocampus, Liver, and Proximal Colon

Affiliations

Chronic Alcohol Exposure and the Circadian Clock Mutation Exert Tissue-Specific Effects on Gene Expression in Mouse Hippocampus, Liver, and Proximal Colon

Keith C Summa et al. Alcohol Clin Exp Res. 2015 Oct.

Abstract

Background: Chronic alcohol exposure exerts numerous adverse effects, although the specific mechanisms underlying these negative effects on different tissues are not completely understood. Alcohol also affects core properties of the circadian clock system, and it has been shown that disruption of circadian rhythms confers vulnerability to alcohol-induced pathology of the gastrointestinal barrier and liver. Despite these findings, little is known of the molecular interactions between alcohol and the circadian clock system, especially regarding implications for tissue-specific susceptibility to alcohol pathologies. The aim of this study was to identify changes in expression of genes relevant to alcohol pathologies and circadian clock function in different tissues in response to chronic alcohol intake.

Methods: Wild-type and circadian Clock(Δ19) mutant mice were subjected to a 10-week chronic alcohol protocol, after which hippocampal, liver, and proximal colon tissues were harvested for gene expression analysis using a custom-designed multiplex magnetic bead hybridization assay that provided quantitative assessment of 80 mRNA targets of interest, including 5 housekeeping genes and a predetermined set of 75 genes relevant for alcohol pathology and circadian clock function.

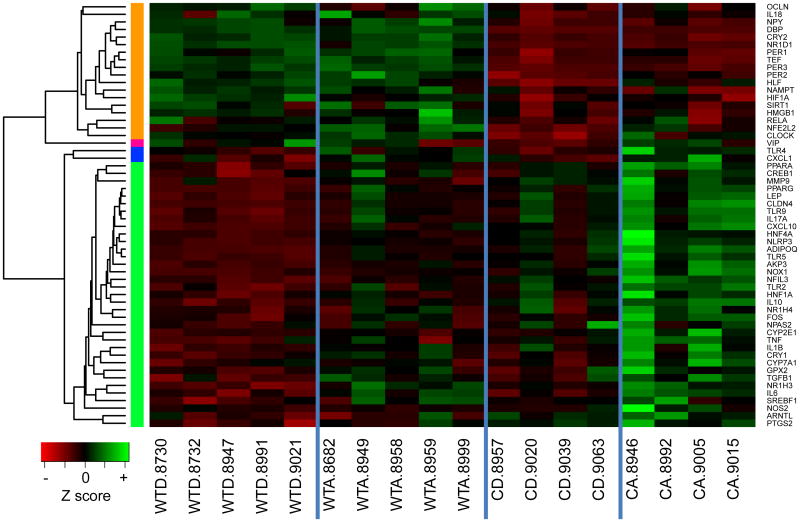
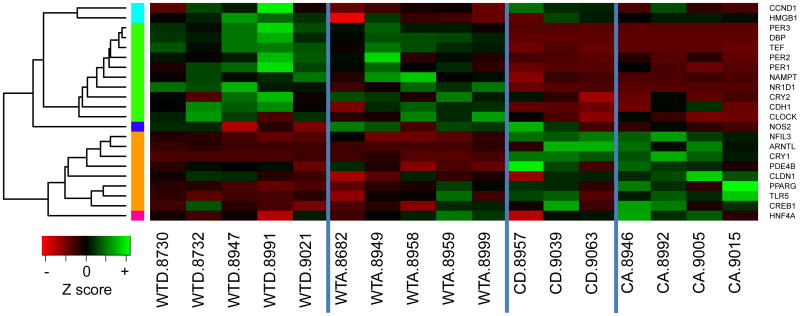
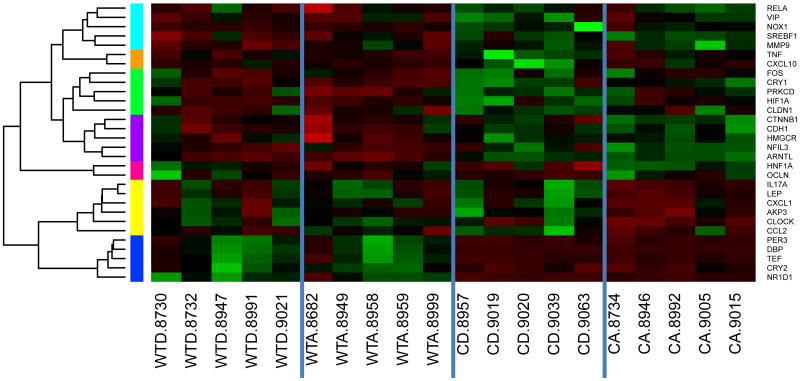
Results: Significant alterations in expression levels attributable to genotype, alcohol, and/or a genotype by alcohol interaction were observed in all 3 tissues, with distinct patterns of expression changes observed in each. Of particular interest was the finding that a high proportion of genes involved in inflammation and metabolism on the array was significantly affected by alcohol and the Clock(Δ19) mutation in the hippocampus, suggesting a suite of molecular changes that may contribute to pathological change.

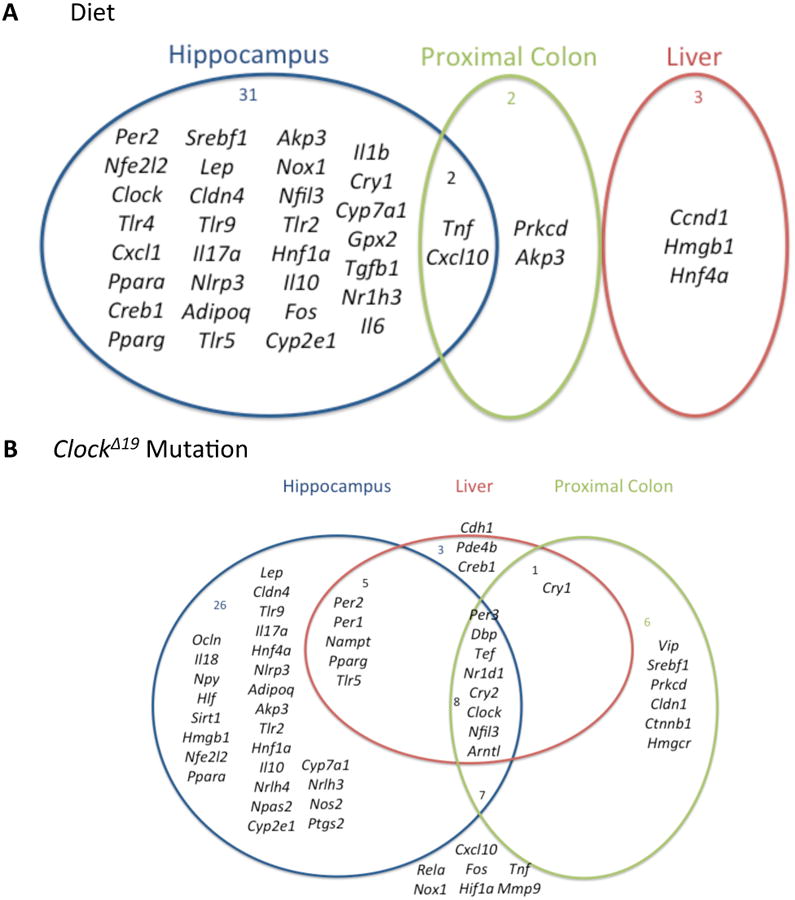
Conclusions: These results reveal the tissue-specific nature of gene expression responses to chronic alcohol exposure and the Clock(Δ19) mutation and identify specific expression profiles that may contribute to tissue-specific vulnerability to alcohol-induced injury in the brain, colon, and liver.

Keywords: Alcohol; Circadian Rhythms; Clock Mutation; Gene Expression; Mouse Models.


Figures

Figure 1
Figure 1. Hippocampal gene expression levels in wild-type (WT) and Clock mutant (C) mice on either an alcohol (A) or dextrose-containing control (D) diet
Expression levels of genes exhibiting significant changes in the hippocampus for at least one term (genotype, alcohol or genotype by alcohol interaction) were normalized as Z scores and plotted as a heatmap. Genes with similar expression patterns were grouped into clusters, depicted by colors on the left side of the graph. The orange cluster reflects groups of genes influenced by genotype. The blue cluster includes genes affected by diet. The pink cluster contains a single gene, Vip, that is characterized by a genotype by diet interaction. The green cluster contains genes affected by genotype as well as alcohol. Cluster color was assigned independently and randomly in each tissue, thus there is no implied association between clusters of the same color in different tissues. Gene symbols are listed on the right side. There were four experimental groups: wild-type dextrose (WTD), wild-type alcohol (WTA), Clock mutant dextrose (CD) and Clock mutant alcohol (CA). Each column represents an individual mouse, denoted by the ID number listed after the experimental group designation. Within the heatmap, green indicates increased expression and red indicates reduced expression, with color intensity reflecting the magnitude of the expression change.
Figure 2
Figure 2. Liver gene expression levels in wild-type (WT) and Clock mutant (C) mice on either an alcohol (A) or dextrose-containing control (D) diet
Expression levels of genes exhibiting significant changes for at least one term (genotype, alcohol or genotype by alcohol interaction) in the liver were normalized as Z scores and plotted as a heatmap. Genes with similar expression patterns were grouped into clusters, depicted by colors on the left side of the graph. The green and orange clusters include genes influenced by genotype. The pink and cyan clusters include genes affected by diet. The blue cluster contains a single gene influenced by a genotype by diet interaction (Nos2). Cluster color was assigned independently and randomly in each tissue, thus there is no implied association between clusters of the same color in different tissues. Gene symbols are listed on the right side. There were four experimental groups: wild-type dextrose (WTD), wild-type alcohol (WTA), Clock mutant dextrose (CD) and Clock mutant alcohol (CA). Each column represents an individual mouse, denoted by the ID number listed after the experimental group designation. Within the heatmap, green indicates increased expression and red indicates reduced expression, with color intensity reflecting the magnitude of the expression change.
Figure 3
Figure 3. Proximal colon expression levels in wild-type (WT) and Clock mutant (C) mice on either an alcohol (A) or dextrose-containing control (D) diet
Expression levels of genes exhibiting significant changes for at least one term (genotype, alcohol or genotype by alcohol interaction) in the proximal colon were normalized as Z scores and plotted as a heatmap. Genes with similar expression patterns were grouped into clusters, depicted by colors on the left side of the graph. The cyan, blue, green and purple clusters contain genes influenced by genotype. The orange cluster includes genes significantly affected by diet. The pink, orange and yellow clusters contain genes impacted by a genotype by alcohol interaction. Cluster color was assigned independently and randomly in each tissue, thus there is no implied association between clusters of the same color in different tissues. Gene symbols are listed on the right side. There were four experimental groups: wild-type dextrose (WTD), wild-type alcohol (WTA), Clock mutant dextrose (CD) and Clock mutant alcohol (CA). Each column represents an individual mouse, denoted by the ID number listed after the experimental group designation. Within the heatmap, green indicates increased expression and red indicates reduced expression, with color intensity reflecting the magnitude of the expression change.
Figure 4
Figure 4. Alcohol (A) and the circadian ClockΔ19 mutation (B) exert tissue-specific effects on gene expression in the mouse hippocampus, liver and proximal colon
(A) Venn diagram listing genes significantly affected by alcohol in the hippocampus (blue circle), liver (red circle) and proximal colon (green circle) in this study. There was very little overlap of significantly affected genes across tissues. (B) Venn diagram listing genes significantly affected by the circadian ClockΔ19 mutation in the hippocampus (blue circle), liver (red circle) and proximal colon (green circle) in this study.

References

    1. Al-Sadi RM, Ma TY. IL-1beta causes an increase in intestinal epithelial tight junction permeability. Journal of immunology. 2007;178:4641–4649. - PMC - PubMed
    1. Bellet MM, Deriu E, Liu JZ, Grimaldi B, Blaschitz C, Zeller M, Edwards RA, Sahar S, Dandekar S, Baldi P, George MD, Raffatellu M, Sassone-Corsi P. Circadian clock regulates the host response to Salmonella. Proceedings of the National Academy of Sciences of the United States of America. 2013;110:9897–9902. - PMC - PubMed
    1. Brager AJ, Prosser RA, Glass JD. Circadian and acamprosate modulation of elevated ethanol drinking in mPer2 clock gene mutant mice. Chronobiol Int. 2011a;28:664–672. - PMC - PubMed
    1. Brager AJ, Ruby CL, Prosser RA, Glass JD. Chronic ethanol disrupts circadian photic entrainment and daily locomotor activity in the mouse. Alcoholism, clinical and experimental research. 2010;34:1266–1273. - PMC - PubMed
    1. Brager AJ, Ruby CL, Prosser RA, Glass JD. Acute ethanol disrupts photic and serotonergic circadian clock phase-resetting in the mouse. Alcoholism, clinical and experimental research. 2011b;35:1467–1474. - PMC - PubMed

Publication types

Associated data

LinkOut - more resources