

Three-dimensional dynamic contrast-enhanced MRI for the accurate, extensive quantification of microvascular permeability in atherosclerotic plaques
- PMID: 26332103
- PMCID: PMC4573915
- DOI: 10.1002/nbm.3369
Three-dimensional dynamic contrast-enhanced MRI for the accurate, extensive quantification of microvascular permeability in atherosclerotic plaques
Abstract
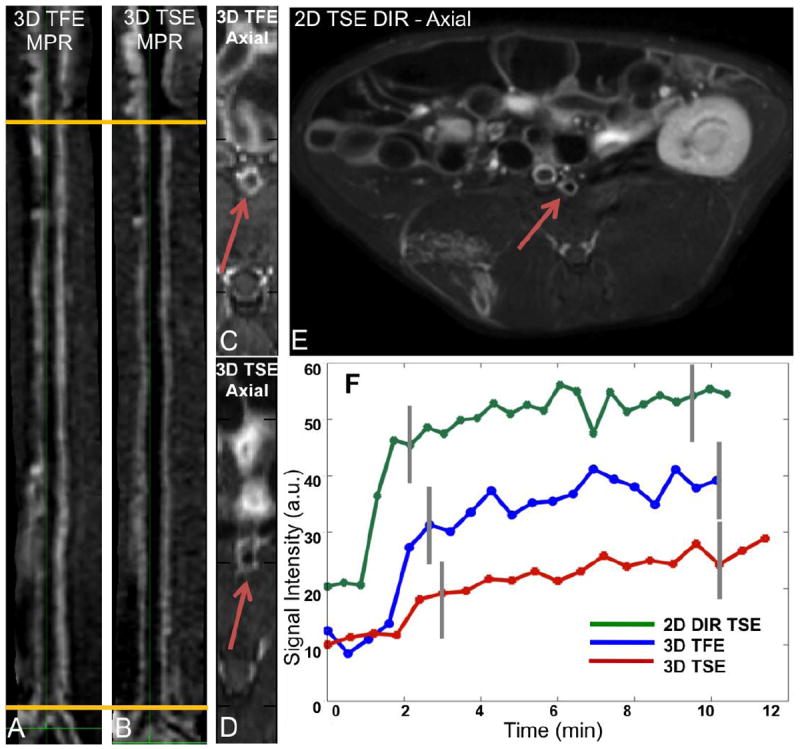
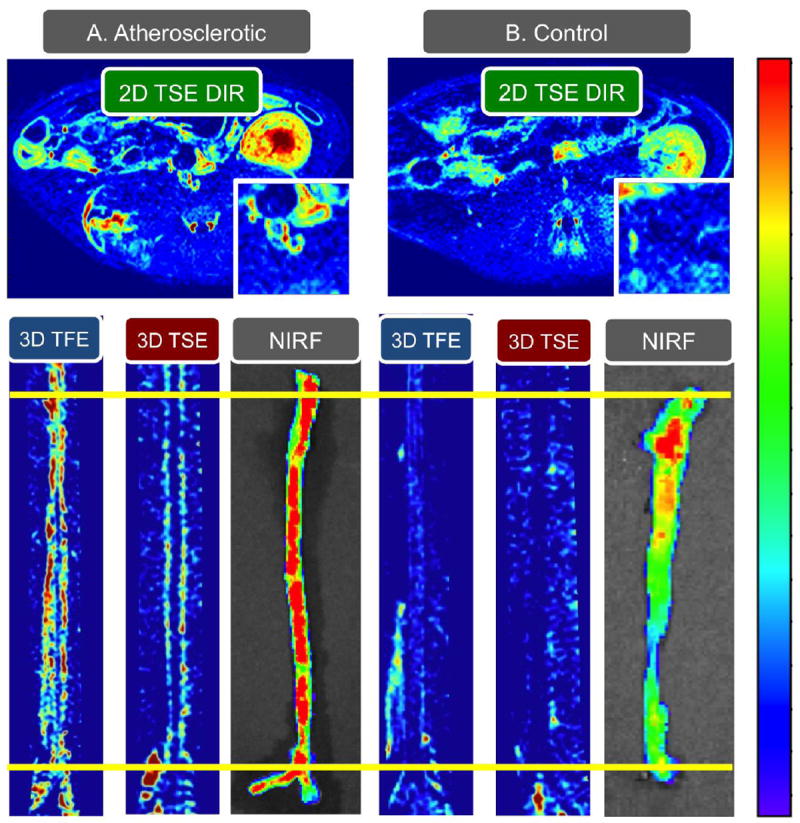
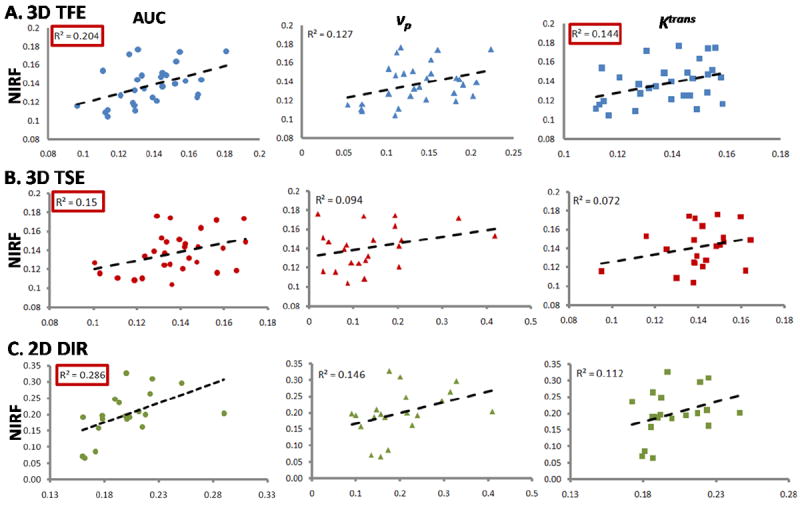
Atherosclerotic plaques that cause stroke and myocardial infarction are characterized by increased microvascular permeability and inflammation. Dynamic contrast-enhanced MRI (DCE-MRI) has been proposed as a method to quantify vessel wall microvascular permeability in vivo. Until now, most DCE-MRI studies of atherosclerosis have been limited to two-dimensional (2D) multi-slice imaging. Although providing the high spatial resolution required to image the arterial vessel wall, these approaches do not allow the quantification of plaque permeability with extensive anatomical coverage, an essential feature when imaging heterogeneous diseases, such as atherosclerosis. To our knowledge, we present the first systematic evaluation of three-dimensional (3D), high-resolution, DCE-MRI for the extensive quantification of plaque permeability along an entire vascular bed, with validation in atherosclerotic rabbits. We compare two acquisitions: 3D turbo field echo (TFE) with motion-sensitized-driven equilibrium (MSDE) preparation and 3D turbo spin echo (TSE). We find 3D TFE DCE-MRI to be superior to 3D TSE DCE-MRI in terms of temporal stability metrics. Both sequences show good intra- and inter-observer reliability, and significant correlation with ex vivo permeability measurements by Evans Blue near-infrared fluorescence (NIRF). In addition, we explore the feasibility of using compressed sensing to accelerate 3D DCE-MRI of atherosclerosis, to improve its temporal resolution and therefore the accuracy of permeability quantification. Using retrospective under-sampling and reconstructions, we show that compressed sensing alone may allow the acceleration of 3D DCE-MRI by up to four-fold. We anticipate that the development of high-spatial-resolution 3D DCE-MRI with prospective compressed sensing acceleration may allow for the more accurate and extensive quantification of atherosclerotic plaque permeability along an entire vascular bed. We foresee that this approach may allow for the comprehensive and accurate evaluation of plaque permeability in patients, and may be a useful tool to assess the therapeutic response to approved and novel drugs for cardiovascular disease.
Keywords: atherosclerosis; compressed sensing; dynamic contrast enhanced (DCE) magnetic resonance imaging (MRI); permeability; rabbits.
Copyright © 2015 John Wiley & Sons, Ltd.
Figures


Similar articles
-
Combined PET/DCE-MRI in a Rabbit Model of Atherosclerosis: Integrated Quantification of Plaque Inflammation, Permeability, and Burden During Treatment With a Leukotriene A4 Hydrolase Inhibitor.JACC Cardiovasc Imaging. 2018 Feb;11(2 Pt 2):291-301. doi: 10.1016/j.jcmg.2017.11.030. JACC Cardiovasc Imaging. 2018. PMID: 29413439
-
Ultra-high resolution, 3-dimensional magnetic resonance imaging of the atherosclerotic vessel wall at clinical 7T.PLoS One. 2020 Dec 14;15(12):e0241779. doi: 10.1371/journal.pone.0241779. eCollection 2020. PLoS One. 2020. PMID: 33315867 Free PMC article.
-
Temporal resolution improvement of calibration-free dynamic contrast-enhanced MRI with compressed sensing optimized turbo spin echo: The effects of replacing turbo factor with compressed sensing accelerations.J Magn Reson Imaging. 2016 Jul;44(1):138-47. doi: 10.1002/jmri.25136. Epub 2015 Dec 29. J Magn Reson Imaging. 2016. PMID: 26713414
-
Dynamic contrast enhanced (DCE) magnetic resonance imaging (MRI) of atherosclerotic plaque angiogenesis.Angiogenesis. 2010 Jun;13(2):87-99. doi: 10.1007/s10456-010-9172-2. Epub 2010 Jun 6. Angiogenesis. 2010. PMID: 20526859 Review.
-
Imaging vascular and hemodynamic features of the brain using dynamic susceptibility contrast and dynamic contrast enhanced MRI.Neuroimage. 2019 Feb 15;187:32-55. doi: 10.1016/j.neuroimage.2018.04.069. Epub 2018 May 3. Neuroimage. 2019. PMID: 29729392 Free PMC article.
Cited by
-
Evaluation of Plaque Characteristics and Inflammation Using Magnetic Resonance Imaging.Biomedicines. 2021 Feb 12;9(2):185. doi: 10.3390/biomedicines9020185. Biomedicines. 2021. PMID: 33673124 Free PMC article. Review.
-
PET/MR Imaging of Malondialdehyde-Acetaldehyde Epitopes With a Human Antibody Detects Clinically Relevant Atherothrombosis.J Am Coll Cardiol. 2018 Jan 23;71(3):321-335. doi: 10.1016/j.jacc.2017.11.036. J Am Coll Cardiol. 2018. PMID: 29348025 Free PMC article.
-
Nanobody-Facilitated Multiparametric PET/MRI Phenotyping of Atherosclerosis.JACC Cardiovasc Imaging. 2019 Oct;12(10):2015-2026. doi: 10.1016/j.jcmg.2018.07.027. Epub 2018 Oct 17. JACC Cardiovasc Imaging. 2019. PMID: 30343086 Free PMC article.
-
Imaging the Permeable Endothelium: Predicting Plaque Rupture in Atherosclerotic Rabbits.Circ Cardiovasc Imaging. 2016 Dec;9(12):e005955. doi: 10.1161/CIRCIMAGING.116.005955. Circ Cardiovasc Imaging. 2016. PMID: 27940960 Free PMC article. No abstract available.
-
Dynamic Contrast-Enhanced MRI to Study Atherosclerotic Plaque Microvasculature.Curr Atheroscler Rep. 2016 Jun;18(6):33. doi: 10.1007/s11883-016-0583-4. Curr Atheroscler Rep. 2016. PMID: 27115144 Free PMC article. Review.
References
-
- Virmani R, Burke AP, Farb A, Kolodgie FD. Pathology of the vulnerable plaque. J Am Coll Cardiol. 2006;47(8 Suppl):C13–18. - PubMed
-
- Virmani R, Ladich ER, Burke AP, Kolodgie FD. Histopathology of carotid atherosclerotic disease. Neurosurgery. 2006;59(5 Suppl 3):S219–227. discussion S213-213. - PubMed
-
- Kerwin W, Hooker A, Spilker M, Vicini P, Ferguson M, Hatsukami T, Yuan C. Quantitative magnetic resonance imaging analysis of neovasculature volume in carotid atherosclerotic plaque. Circulation. 2003;107(6):851–856. - PubMed
-
- Calcagno C, Cornily JC, Hyafil F, Rudd JH, Briley-Saebo KC, Mani V, Goldschlager G, Machac J, Fuster V, Fayad ZA. Detection of neovessels in atherosclerotic plaques of rabbits using dynamic contrast enhanced MRI and 18F-FDG PET. Arteriosclerosis, thrombosis, and vascular biology. 2008;28(7):1311–1317. - PMC - PubMed
-
- Chen H, Ricks J, Rosenfeld M, Kerwin WS. Progression of experimental lesions of atherosclerosis: Assessment by kinetic modeling of black-blood dynamic contrast-enhanced MRI. Magn Reson Med. 2012 - PubMed
Publication types
MeSH terms
Substances
Grants and funding
LinkOut - more resources
Full Text Sources
Other Literature Sources
Medical
