. 2015 Sep 2;10(9):e0136466.
doi: 10.1371/journal.pone.0136466. eCollection 2015.

Promoter-Dependent Translation Controlled by p54nrb and hnRNPM during Myoblast Differentiation

Affiliations

Promoter-Dependent Translation Controlled by p54nrb and hnRNPM during Myoblast Differentiation

Nadera Ainaoui et al. PLoS One. .

Abstract

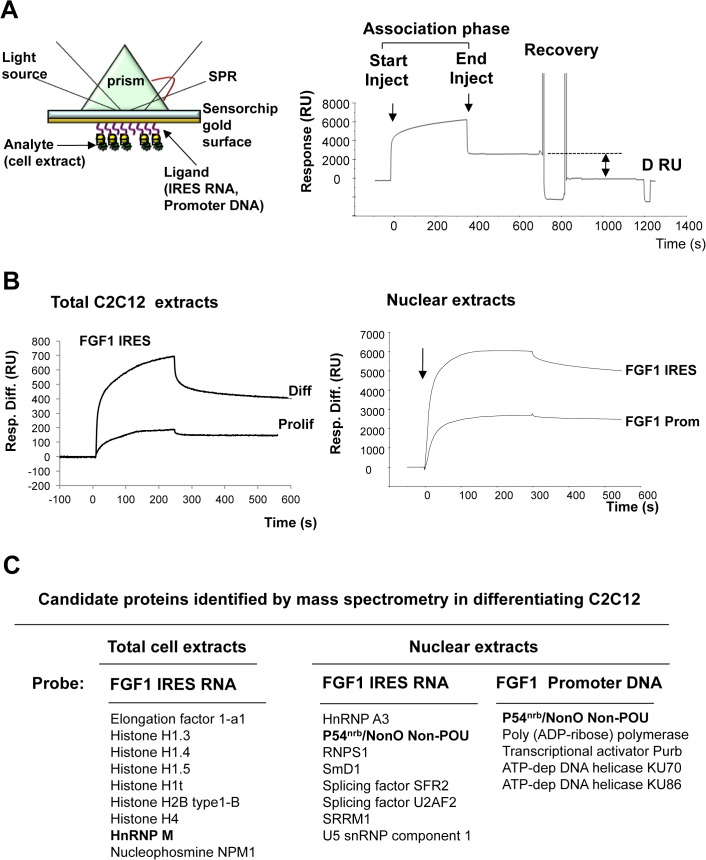
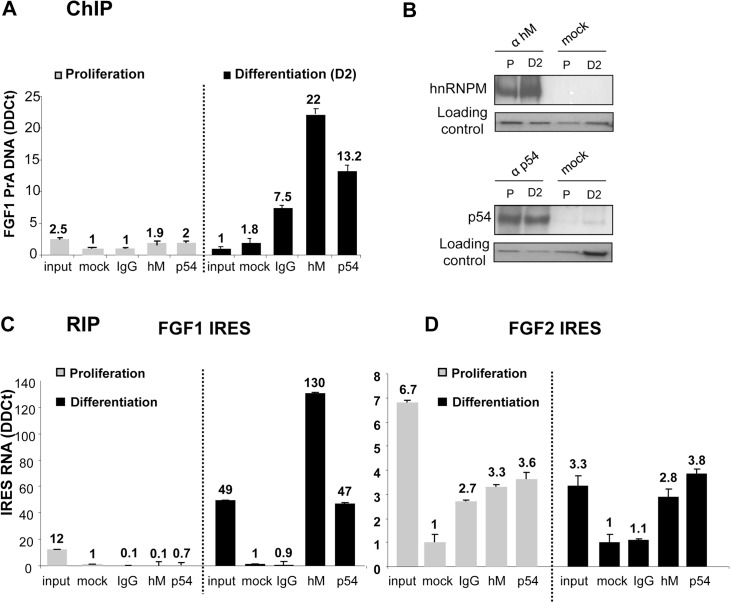
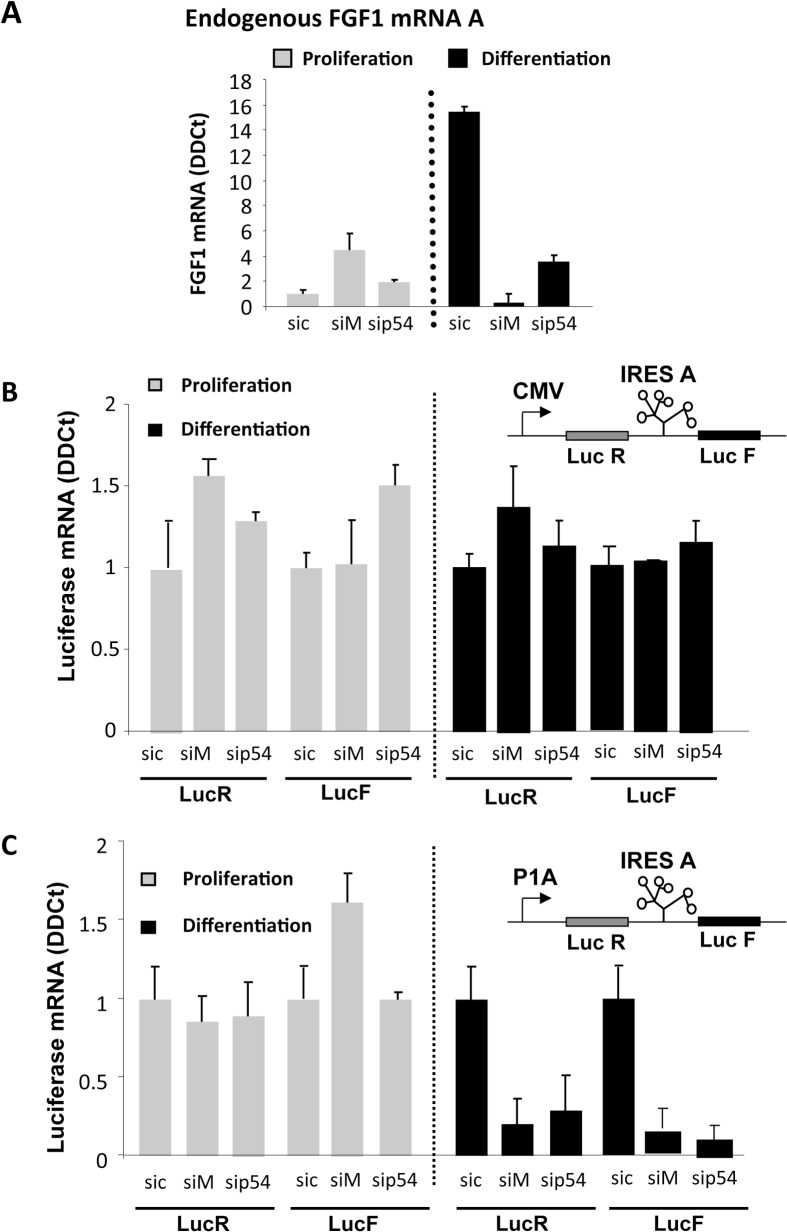
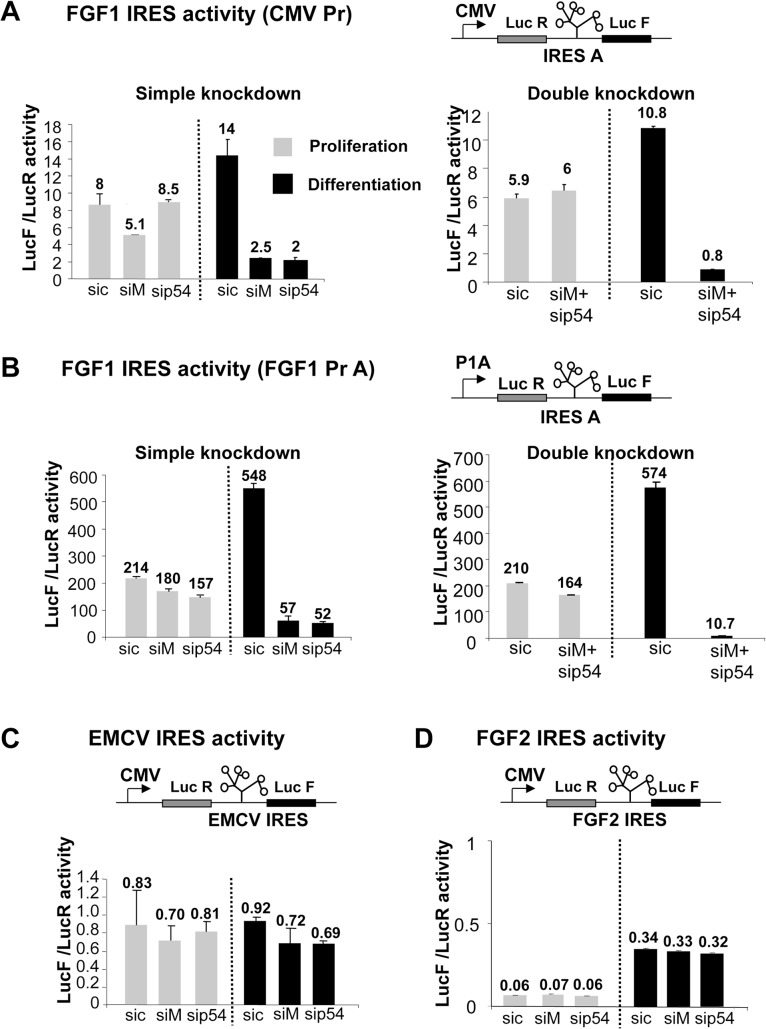
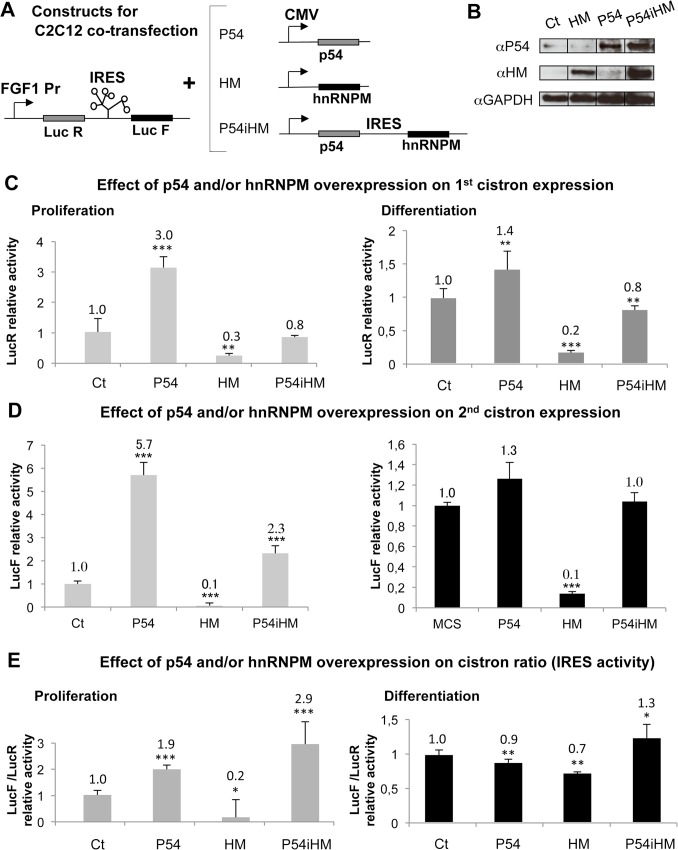
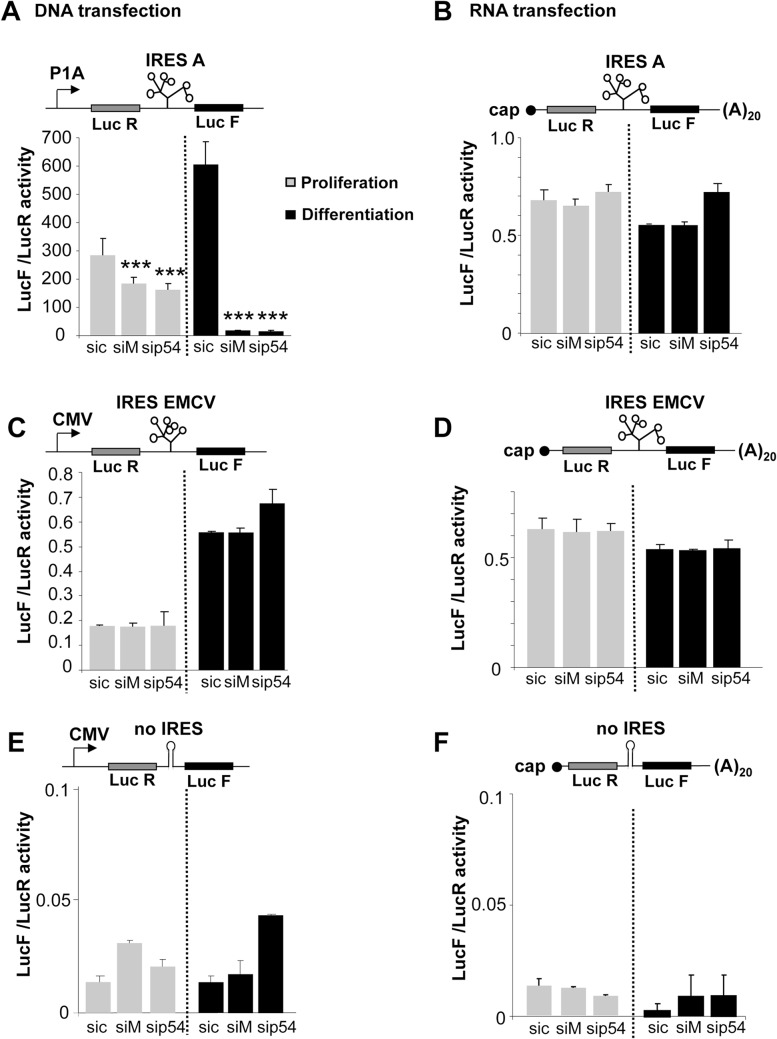
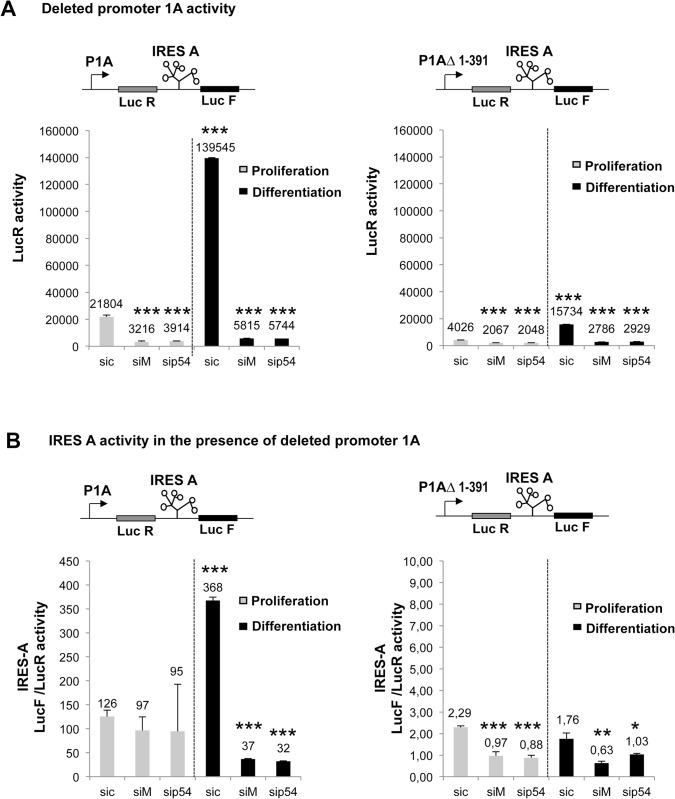
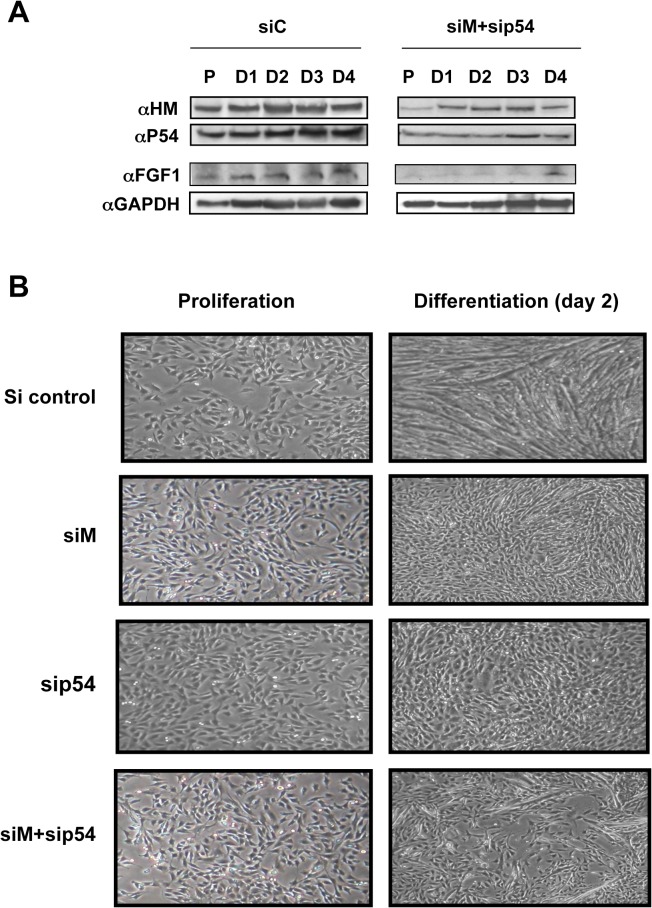
Fibroblast growth factor 1 (FGF1) is induced during myoblast differentiation at both transcriptional and translational levels. Here, we identify hnRNPM and p54nrb/NONO present in protein complexes bound to the FGF1 promoter and to the mRNA internal ribosome entry site (IRES). Knockdown or overexpression of these proteins indicate that they cooperate in activating IRES-dependent translation during myoblast differentiation, in a promoter-dependent manner. Importantly, mRNA transfection and promoter deletion experiments clearly demonstrate the impact of the FGF1 promoter on the activation of IRES-dependent translation via p54nrb and hnRNPM. Accordingly, knockdown of either p54 or hnRNPM also blocks endogenous FGF1 induction and myotube formation, demonstrating the physiological relevance of this mechanism and the role of these two proteins in myogenesis. Our study demonstrates the cooperative function of hnRNPM and p54nrb as regulators of IRES-dependent translation and indicates the involvement of a promoter-dependent mechanism.


Conflict of interest statement

Competing Interests: The authors have declared that no competing interests exist.

Figures

Fig 1
Fig 1. Identification of RNA and DNA binding proteins by BIA-MS.
(A) BIACORE 3000 analysis using surface plasmon resonance. Left: the ligand corresponding to biotinylated RNA or DNA is immobilized by streptavidin coupled to the sensorchip gold surface. On the other side of the sensorchip, a light source is directed to the sensorchip through a prism and is reflected in all angles except one at which it is absorbed into the gold surface in the form of an evanescent wave. The binding of the analyte corresponding to RNA or DNA binding proteins to the ligand results in a change in the index of refraction proportional to the number of bound molecules. This generates a shift in the absorption angle that is recorded by the detector and appears on a sensogram. Right: Sensogram generated during a binding cycle followed by protein recovery. The response appears in resonance units (RU). The association phase lasts from the start to the end of analyte injection (400 s). Protein recovery is achieved at 800 s and the ΔRU indicates the efficiency of dissociation of the bound proteins. (B) C2C12 myoblast protein binding and recovery. Total extracts of proliferating or differentiating C2C12 myoblasts (left) or nuclear extracts of differentiating C2C12 (right) were injected as analytes in several BIACORE 3000 channels after immobilization of ligands corresponding to FGF1 IRES A RNA (nt 1 to 442) or promoter A DNA (distal part nt 1 to 391). Bound proteins were recovered as described in Mat. & Meth. (C) Mass spectrometry analysis of proteins recovered from the BIACORE 3000 experiments. For each BIA-MS experiment, 6 recovery cycles were pooled to obtain a sufficient RU quantity (about 2000 RU). The mass spectrometry analysis was performed as described in Mat. & Meth. The most significant proteins (RNA and DNA binding proteins) are listed here, whereas the complete list is provided in S1 File. hnRNPM and p54nrb have been selected as the most interesting candidates.
Fig 2
Fig 2. Interaction of hnRNPM and p54nrb proteins with FGF1 promoter and IRES.
(A) ChIP assays were performed as described in Mat. & Meth. with genomic DNA purified and fragmented from C2C12 extracts in proliferation (left panel) or differentiation 2 days after serum-starvation treatment (right panel). Immunoprecipitation experiments were performed with anti-hnRNPM (1/D8), anti-p54nrb antibodies, control IgG provided by the manufacturer (IgG) or without antibodies (mock), respectively. qPCR quantification was achieved with primers specific to the 1–391 FGF1-A promoter fragment or with primers specific to the TBP gene used as the reference gene. The values are expressed relatively to the reference gene. Experiments were performed in biological triplicates and repeated three times. A representative experiment is shown (mean +- standard deviation). (B) HnRNPM and p54nrb protein levels were analyzed by immunoprecipitation followed by Western blotting in proliferating (P) or differentiating (day 2 after serum-starvation, D2) C2C12 cell lysates, using anti-hnRNPM or antip54 antibodies. The loading control was checked by Ponceau Red staining. (C, D) RIP assays were performed as described in Mat. & Meth. with cell lysates from proliferating or differentiating myoblasts. Immunoprecipitation was achieved as in (A). RNAs present in the immunoprecipitated complexes were quantified by RT qPCR using primers specific to the FGF1 (C) or FGF2 IRES (D). The reference gene was 18S RNA, reflecting non specific RNA binding. The values are expressed relatively to the control (mock) without antibody. Experiments were performed in biological triplicates and repeated three times. A representative experiment is shown (mean +- standard deviation).
Fig 3
Fig 3. Effect of hnRNPM and p54nrb knockdown on expression of endogenous FGF1 mRNA and bicistronic mRNAs during myoblast differentiation.
(A) RT qPCR quantification of endogenous FGF1 mRNA A was performed as described in Mat. & Meth. during C2C12 myoblast proliferation or day 2 differentiation after transfection with siRNA ONE TARGET PLUS smartpool against hnRNPM (siM), p54nrb (sip54) or siRNA control (sic). mRNA quantification was standardized with RNA 18S. Experiments were performed in biological triplicates and repeated three times. A representative experiment is shown (mean +- standard deviation). The knockdown efficiency, analyzed by Western blot, is shown in S2 File and was also checked by RT qPCR (not shown). (B, C) C2C12 cells co-transfected with bicistronic plasmids and 48h later with siRNA siM, sip54 or sic as above. Renilla luciferase (LucR, left) and firefly luciferase (LucF, right) mRNA levels were quantified by RT qPCR during C2C12 myoblast proliferation (grey histograms) and differentiation (black histograms), standardized to 18S RNA. The bicistronic cassette contains either the CMV promoter (B) or the FGF1 promoter A (C). For each experiment, values are shown relatively to the siRNA control. Experiments were performed in biological triplicates and repeated at least three times. A representative experiment is shown (mean +- standard deviation).
Fig 4
Fig 4. Effect of hnRNPM and/or p54nrb knockdown on the regulation of FGF1 IRES A activity during myoblast differentiation.
C2C12 cells were first transfected with bicistronic plasmids and 48h later with siRNAs targeting hnRNPM (siM), p54nrb (sip54) or control (sic), (see Fig 3). Luciferase activities were measured as described in Mat. & Meth two days after siRNA transfection, from C2C12 myoblasts maintained in proliferation (grey histogram) or serum-starved to induce differentiation (day 2, black histogram). The bicistronic cassette contains LucR and LucF reporter genes, separated by different IRESs (FGF1, FGF2 or EMCV). LucR and LucF activities reflect the cap-dependent and IRES dependent translation, respectively [4]. The knockdown efficiency was checked by Western blot (S2 File). (A, B) FGF1 IRES activities were measured in C2C12 myoblasts in proliferation (grey histogram) and differentiation two days after serum-starvation treatment (black histogram). The bicistronic constructs are schematized. The bicistronic cassette is under the control of either the CMV promoter (A) or the FGF1 promoter A (B). Single and double knockdowns are shown in left and right panels, respectively. IRES activities are represented as LucF/LucR ratios. (C, D). Absence of effect of hnRNPM and/or p54nrb knockdown on the regulation of EMCV and FGF2 IRESs during myoblast differentiation. Activities of EMCV (C) and FGF2 (D) IRESs were measured as above. For all panels, experiments were performed in biological triplicates and repeated at least three times. A representative experiment is shown (mean +- standard deviation).
Fig 5
Fig 5. Cooperative effect of p54nrb and hnRNPM on FGF1 IRES activation.
(A) Schema of the constructs used for C2C12 cell co-transfection. The target plasmid is the bicistronic dual luciferase vector with the FGF1 promoter and IRES. The effector plasmids express p54nrb (p54) or hnRNPM (HM), or co-express p54nrb and hnRNPM. The latter plasmid is a bicistronic contruct containing the FGF1 IRES. (B) Western blots of transfected proliferating C2C12 cell extracts using antibodies against p54(αHM), hnRNPM (αHM) of GAPDH as a control (αGAPDH). (C-E) Luciferase activities measurement of co-transfected proliferating or differentiating C2C12 cell extracts. LucR activity reflects the FGF1 mRNA promoter activity (as cap-dependent translation does not significantly vary, as shown by RNA transfection, see Table B in S4 File) (C). LucF reflects IRES-dependent translation but is also dependent on mRNA amount (D). LucF/LucR ratio reflects the IRES activity normalized to mRNA amount, expressed relatively to the control (co-transfection with empty vector) (E). Experiments were performed in biological triplicates and repeated three times. The statistical test used is the Student test. (mean +- standard deviation, *p<0.05, **p<0.01, ***<0.001).
Fig 6
Fig 6. Comparison of IRES activities following DNA or RNA transfection.
(A, C, E) C2C12 cells were transfected with bicistronic plasmids containing either the FGF1 IRES, or EMCV IRES or a hairpin (control without IRES) and with siRNA siM, sip54 or sic, and IRES activities measured as in Fig 4B, 4D and 4F C2C12 cells were transfected with siRNA siM, sip54 or sic and 24h later with bicistronic mRNAs containing either the FGF1 IRES, or the EMCV IRES, or a hairpin as above. mRNAs were transcribed in vitro, capped and polyadenylated, as described in Mat. & Meth. The LucF/LucR activity ratio was measured 12h post-transfection. Experiments were performed in biological triplicates and repeated three times. The Student test was used. A representative experiment is shown (mean +- standard deviation, *p<0.05, **p<0.01, ***<0.001). For A and B, the Luc R and Luc F values are shown in S4 File.
Fig 7
Fig 7. Influence of transcription level on the activity of the FGF1 IRES A.
C2C12 cells were transfected with bicistronic plasmids containing either the complete promoter 1A or a deleted promoter lacking nucleotides 1 to 391. Transfected cells were treated 24h later with siRNA siM, sip54 or sic, and luciferase activities were measured as in Fig 6. (A) mRNA expression in the presence of promoter 1A and 1AΔ1–391 reflected by the LucR activities. (B) Activity of FGF1 IRES A in the presence of promoter 1A and 1AΔ1–391, reflected by the Luc F/ LucR ratio as above. Experiments were performed in biological triplicates and repeated three times. The statistical test used is the Student test. (mean +- standard deviation, *p<0.05, **p<0.01, ***<0.001).
Fig 8
Fig 8. Role of hnRNPM and p54nrb in myoblast differentiation.
(A) Effect of hnRNPM and p54nrb knockdown on expression of endogenous FGF1. C2C12 cells were transfected with siRNA, siM+sip54 or sic. Western blot was performed as above using cell extracts of proliferating (P) and differentiating myoblasts (D1 to D4). GAPDH was used as a normalization control. These data correspond to a representative experiment (repeated at least three times). (B) Effect of hnRNPM and/or p54nrb knockdown on myotube formation. C2C12 cells were transfected with siRNA siM, sip54, siM+sip54 or sic and myotube formation was followed by phase contrast microscopy. Data are shown for day 2 cells compared to proliferative cells.

References

    1. Braunschweig U, Gueroussov S, Plocik AM, Graveley BR, Blencowe BJ. Dynamic integration of splicing within gene regulatory pathways. Cell. 2013. March 14;152(6):1252–69. Pubmed Central PMCID: 3642998. Epub 2013/03/19. eng. 10.1016/j.cell.2013.02.034 - DOI - PMC - PubMed
    1. Maniatis T, Reed R. An extensive network of coupling among gene expression machines. Nature. 2002. April 4;416(6880):499–506. . - PubMed
    1. Pandit S, Wang D, Fu XD. Functional integration of transcriptional and RNA processing machineries. Curr Opin Cell Biol. 2008. June;20(3):260–5. 10.1016/j.ceb.2008.03.001 - DOI - PMC - PubMed
    1. Conte C, Ainaoui N, Delluc-Clavieres A, Khoury MP, Azar R, Pujol F, et al. Fibroblast growth factor 1 induced during myogenesis by a transcription-translation coupling mechanism. Nucleic Acids Res. 2009. September;37(16):5267–78. 10.1093/nar/gkp550 - DOI - PMC - PubMed
    1. Madiai F, Hackshaw KV, Chiu IM. Characterization of the entire transcription unit of the mouse fibroblast growth factor 1 (FGF-1) gene. Tissue-specific expression of the FGF-1.A mRNA. J Biol Chem. 1999. April 23;274(17):11937–44. . - PubMed

Publication types

MeSH terms

Substances