. 2015 Sep 2;10(9):e0134988.
doi: 10.1371/journal.pone.0134988. eCollection 2015.

What are the Evolutionary Origins of Mitochondria? A Complex Network Approach

Affiliations

What are the Evolutionary Origins of Mitochondria? A Complex Network Approach

Daniel S Carvalho et al. PLoS One. .

Abstract

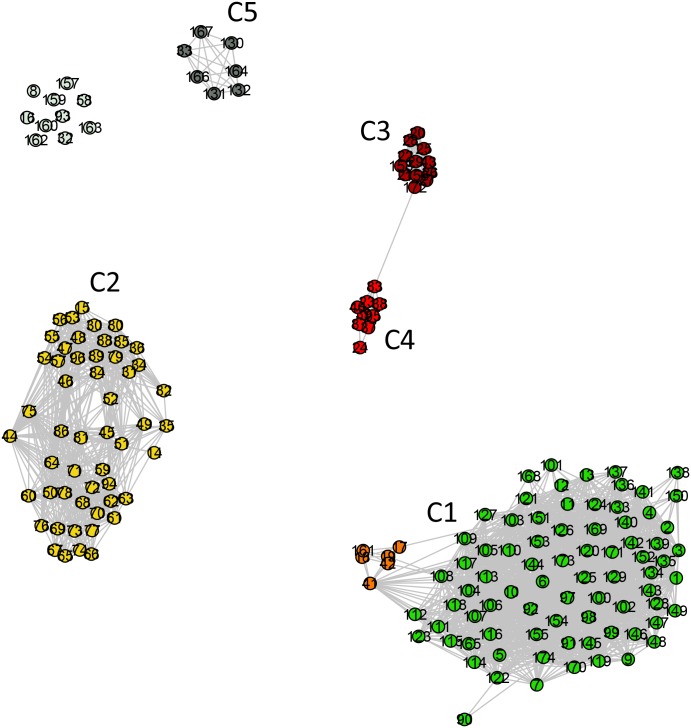
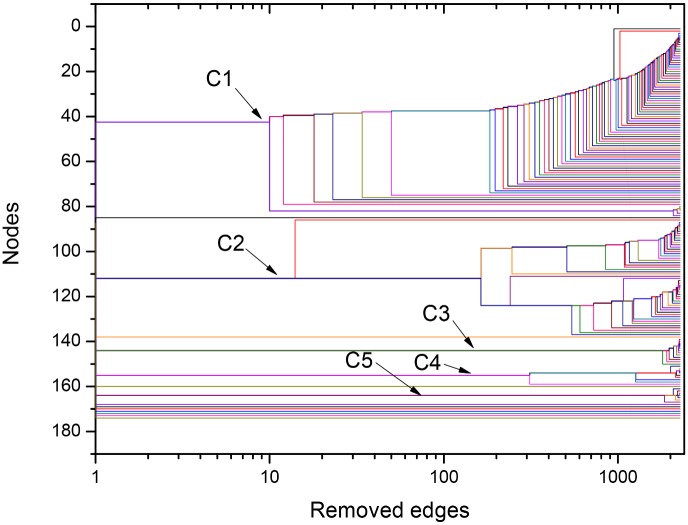
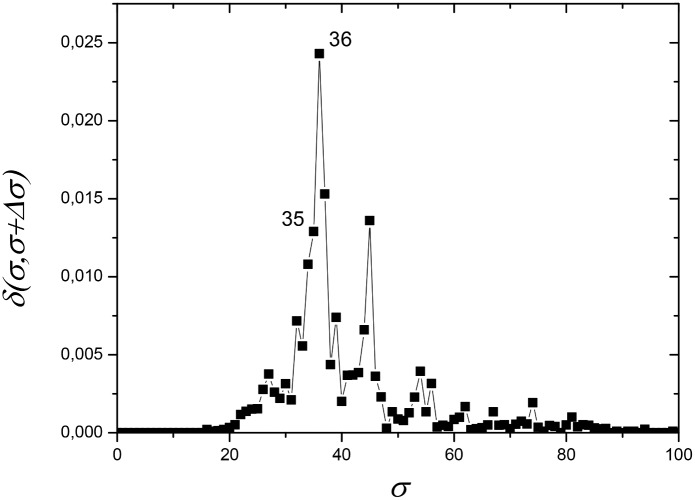
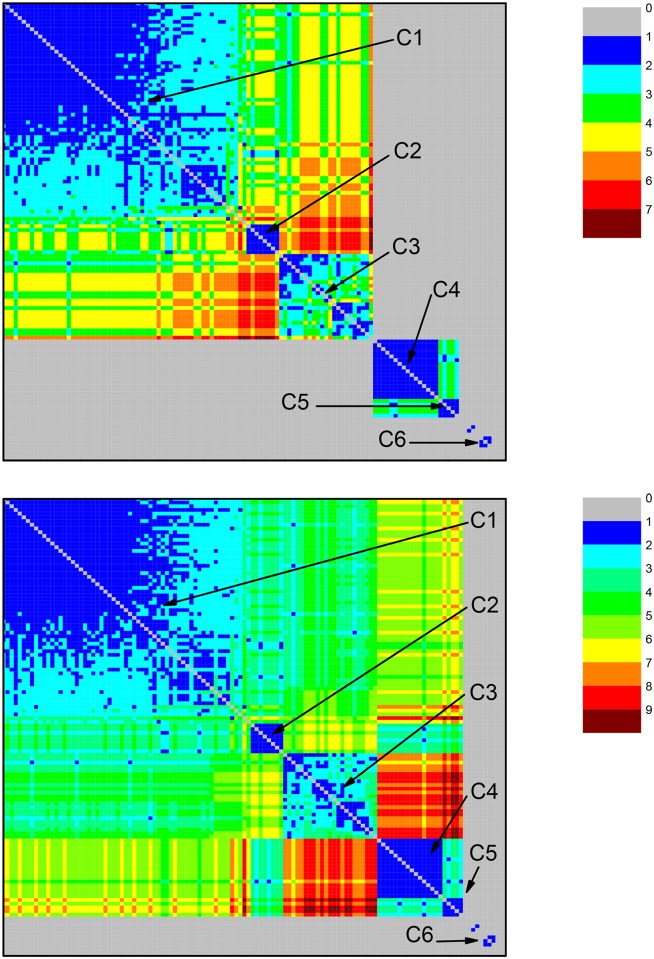
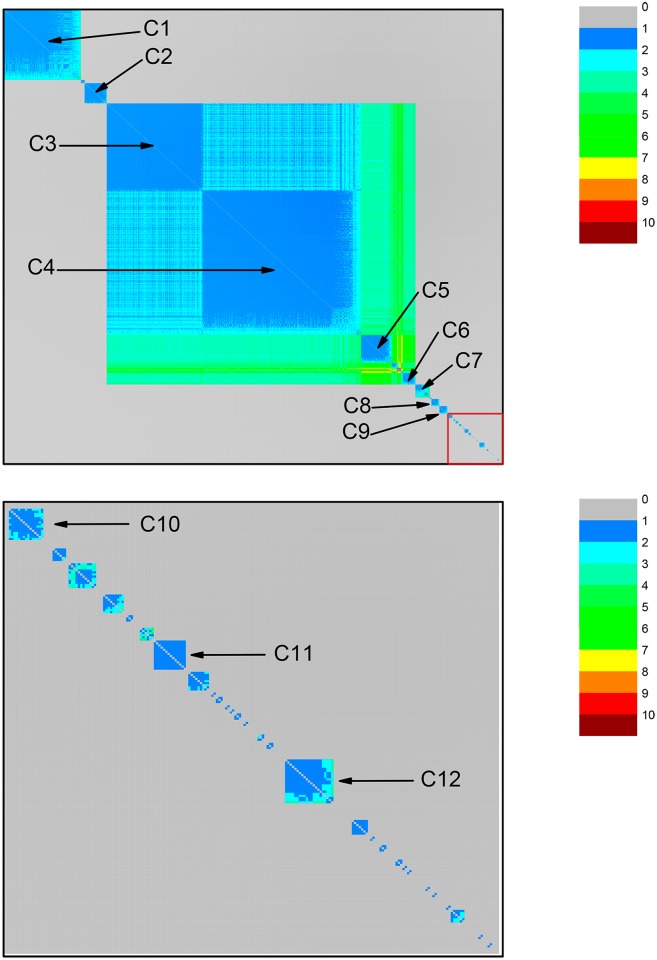
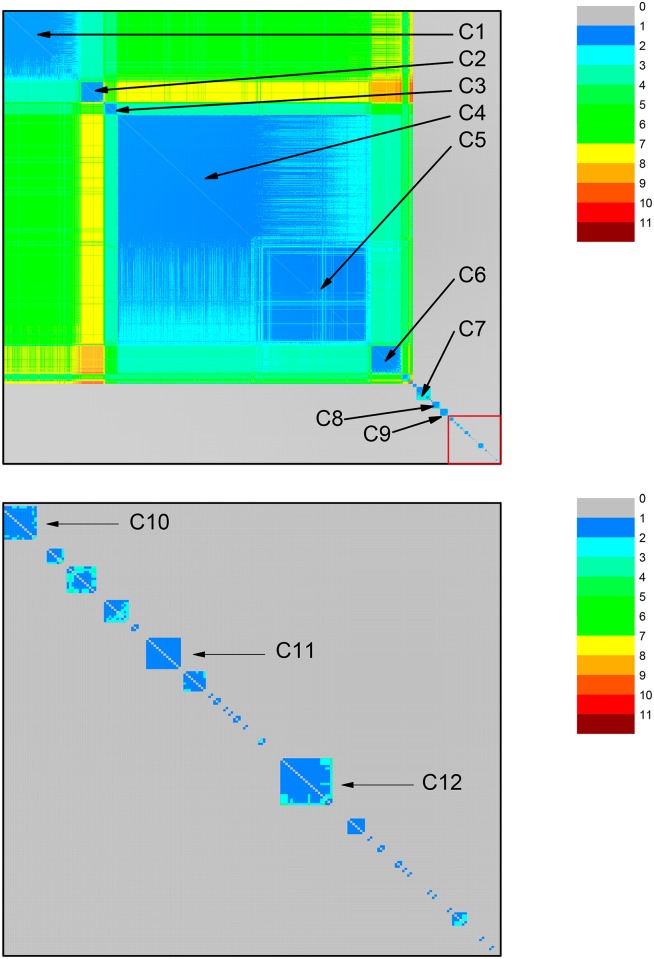
Mitochondria originated endosymbiotically from an Alphaproteobacteria-like ancestor. However, it is still uncertain which extant group of Alphaproteobacteria is phylogenetically closer to the mitochondrial ancestor. The proposed groups comprise the order Rickettsiales, the family Rhodospirillaceae, and the genus Rickettsia. In this study, we apply a new complex network approach to investigate the evolutionary origins of mitochondria, analyzing protein sequences modules in a critical network obtained through a critical similarity threshold between the studied sequences. The dataset included three ATP synthase subunits (4, 6, and 9) and its alphaproteobacterial homologs (b, a, and c). In all the subunits, the results gave no support to the hypothesis that Rickettsiales are closely related to the mitochondrial ancestor. Our findings support the hypothesis that mitochondria share a common ancestor with a clade containing all Alphaproteobacteria orders, except Rickettsiales.


Conflict of interest statement

Competing Interests: The authors have declared that no competing interests exist.

Figures

Fig 1
Fig 1. Network distance δ(σ,σ+Δσ) (see eq (1) in Materials and Methods section) between two networks, constructed from the same similarity matrix S at nearby values of σ, as a function of σ for ATP synthase subunits 9 and c.
σ is the threshold of sequence similarity used to construct a network, ranging from 0% to 100% with interval Δσ = 1%. On the vertical axis, δ is the distance value between two networks constructed at subsequent values σ and σ+Δσ. Large peaks (higher distance values), at σ = σ max = 56% and σ = 62%, indicate values of σ at which the networks undergo large structural changes. Modular components can be better revealed when modularity analysis is carried out for networks at these values of σ.
Fig 2
Fig 2. Community structure revealed by the color representation of the neighborhood matrices (NM) of two networks based on the dataset for ATP synthase subunits 9 and c at the values of σ corresponding to two high peaks in Fig 1.
Two network nodes can be: i) directly connected (shown in blue) when they are linked by an edge; ii) indirectly connected, when it is possible to go from one node to the other by a path formed by a finite number of edges (steps) between directly connected intermediate nodes; in the current case, the maximal number of steps is four, as indicated by the color code bar; iii) disconnected nodes (shown in color gray), when they cannot be linked by any path going through directly connected nodes. Squares placed along the diagonal, labeled as Ci, i = 1–5, reveal communities formed by subsets of proteins (organisms). Top panel: NM at σ = σ max = 56%. Bottom panel: NM at σ = 62%. Communities C1 and C2, which are still connected at σ = 56%, become disconnected at σ = 62%. In the bottom panel it is possible to recognize the emergence of a small sub-community (small blue square at the lower right corner) of community C1, which was not yet revealed in the top panel. C1 (composed of mitochondrial sequences) and C2 (composed of alphaproteobacterial sequences) are connected. C3 and C4 (sequences from Rickettsiales) are disconnected from the other communities, including C1.
Fig 3
Fig 3. Standard network representation for ATP synthase subunits 9 and c network at σ = σ max = 56% (using GePhi package [34]).
A color code, with different meaning as compared to that used in Fig 2, is used to highlight five communities pointed out in that figure. Dark gray denotes the nodes in the non-relevant community C5 and light gray indicates completely disconnected nodes.
Fig 4
Fig 4. Dendrogram obtained during the NG community finding algorithm (NGA), based on the successive elimination of links with highest value of betweenness centrality (as defined in the Network Analysis subsection within the Materials and Methods section) for ATP synthase subunits 9 and c at σ = σ max = 56%.
The betweeness centrality of a link is proportional to the number of paths linking any pair of nodes that pass through it. In Fig 3, the edges that connect node 83 with nodes between communities C3 and C4, as well as the edges that directly connect nodes in C1 to nodes in C2, have large betweenness centrality. They are the first edges eliminated in the NGA. The dendrogram is in agreement with results in Figs 2 and 3, indicating that, at σ = σ max, the network is constituted by the three following clusters: C1+C2, C3+C4, C5. Two branching events, in which C1 detaches from C2 and C3 detaches from C4, require the elimination of relatively small number of edges.
Fig 5
Fig 5. Standard network representation for ATP synthase subunits 9 and c at σ = 62% (using GePhi [34]).
As in Fig 3, a new color code is used to highlight five communities first pointed out in Fig 2. Note that communities C1 and C2 are detached. Two different colors are used in C1: orange nodes represent Rhodospirillales, and green nodes represent mitochondrial sequences.
Fig 6
Fig 6. Dendrogram produced by the successive elimination of links with largest value of betweenness for ATP synthase subunits 9 and c at σ = 62%.
In agreement with Figs 2b and 5, the five communities Ci, i = 1–5, are completely separated from each other, except for the communities C3 and C4 that are connected by one edge. The small sub-community in C1 (orange nodes in Fig 5) becomes detached from the main community in the first branching event after 10 connections have been eliminated.
Fig 7
Fig 7. Network distance δ(σ,σ+Δσ) (see eq (1) in Materials and Methods section) between two networks at nearby values of σ as a function of σ for ATP synthase subunits 4 and b.
A large peak at σ = σ max = 36% dominates the curve. To better discuss the community building process, the results for the network at σ = 35% have also been investigated.
Fig 8
Fig 8. Community structure revealed by the color representation of the neighborhood matrices (NM) of two networks based on the dataset for ATP synthase subunits 4 and b at values σ = 36%—top panel—and σ = 35%—bottom panel.
The discussion in the caption of Fig 2 on color codes and other features of the graphs also applies. At σ = 35%, six relevant communities are identified as Ci, i = 1–6, Only C6 is separated from all the other five communities. At σ = 36%, the large group splits into two subgroups, respectively formed by C1, C2, C3, and C4, C5. Different color codes indicate larger paths, linking nodes from C3 and C5 when σ = 35%, but which are no longer present at σ = 36%.
Fig 9
Fig 9. Standard network representation for ATP synthase subunits 4 and b at σ = 36% (using GePhi [34]).
As in Figs 3 and 5, a new color code is used to highlight six communities pointed out in Fig 8. Isolated nodes are also present.
Fig 10
Fig 10. Standard network representation for ATP synthase subunits 4 and b at σ = 35% (using GePhi [34]).
The six communities in Figs 8 and 9 can also be identified. Note that the connection between the two community groups that become separated at σ = 35% is also provided between nodes in communities C2 and C4.
Fig 11
Fig 11. Dendrogram produced by the successive elimination of links with largest value of betweenness for ATP synthase subunits 4 and b at σ = 35%.
The branching event separating the two groups occurs after the elimination of the two links that can be identified in Fig 10. The dynamical process of connection elimination clearly indicates three further important branching events: the first separates C3 from the group C1+C2, the second separates C1 from C2, and the third separates C4 from C5.
Fig 12
Fig 12. Network distance δ(σ,σ+Δσ) (see eq (1) in Materials and Methods section) between two networks at nearby values of σ as a function of σ for ATP synthase subunits 6 and a.
A large peak at σ = σ max = 57%, dominates the curve. The networks formed by ATP synthase subunit 6 and ATP synthase subunit a protein sequences are constituted by 1964 nodes. Community analyses at σ = 56% and σ = 57% have been performed.
Fig 13
Fig 13. Community structure revealed by the color representation of the neighborhood matrix (NM) of a network with 1964 nodes based on the dataset for ATP synthase subunits 6 and a at σ = 57%.
The large number of protein sequences in the dataset lead to a much larger number of communities, of which at least 12 are relevant and indicated by Ci, i = 1–12. The bottompanel represents an enlargement of the right lower corner of the top panel, in order to make three small communities (C10, C11, and C12) visible.
Fig 14
Fig 14. Community structure revealed by the color representation of the neighborhood matrix (NM) of the network with 1964 nodes based on the dataset for ATP synthase subunits 6 and a at σ = 56%.
At this lower threshold value, two communities (C1 and C2) that in Fig 13 are detached from the large group composed of communities C3–C9, have joined this group, which is composed of communities Ci, i = 1–9. The bottom panel represents an enlargement of the right lower corner of the top panel in order to make three small communities (C10, C11, and C12) visible.

References

    1. Schwartz RM, Dayhoff MO (1978) Origins of prokaryotes, eukaryotes, mitochondria, and chloroplasts. Science 199:395–403. 10.1126/science.202030 - DOI - PubMed
    1. Esser C, Ahmadinejad N, Wiegand C, Rotte C, Sebastiani F, Gelius-Dietrich G, et al. (2004) A genome phylogeny for mitochondria among α-Proteobacteria and a predominantly eubacterial ancestry of yeast nuclear genes. Molecular Biology and Evolution 21: 1643–1660. 10.1093/molbev/msh160 - DOI - PubMed
    1. Fitzpatrick DA, Creevey CJ, McInerney JO (2006) Genome phylogenies indicate a meaningful α-proteobacterial phylogeny and support a grouping of the mitochondria with the Rickettsiales. Molecular Biology and Evolution 23:74–85. 10.1093/molbev/msj009 - DOI - PubMed
    1. Atteia A, Adrait A, Brugière S, Tardif M, van Lis R, Deusch O, et al. (2009) A proteomic survey of Chlamydomonas reinhardtii mitochondria sheds new light on the metabolic plasticity of the organelle and on the nature of the α-Proteobacterial mitochondrial ancestor. Molecular Biology and Evolution 26:1533–1548. 10.1093/molbev/msp068 - DOI - PubMed
    1. Chang X, Wang Z, Hao P, Li Y-Y, Li Y-X (2010) Exploring mitochondrial evolution and metabolism organization principles by comparative analysis of metabolic networks. Genomics 95: 339–344. 10.1016/j.ygeno.2010.03.006 - DOI - PubMed

Publication types

MeSH terms

Substances

LinkOut - more resources