. 2016 Mar;26(3):341-61.
doi: 10.1002/hipo.22526. Epub 2015 Oct 10.

Mapping the electrophysiological and morphological properties of CA1 pyramidal neurons along the longitudinal hippocampal axis

Affiliations

Mapping the electrophysiological and morphological properties of CA1 pyramidal neurons along the longitudinal hippocampal axis

Ruchi Malik et al. Hippocampus. 2016 Mar.

Abstract

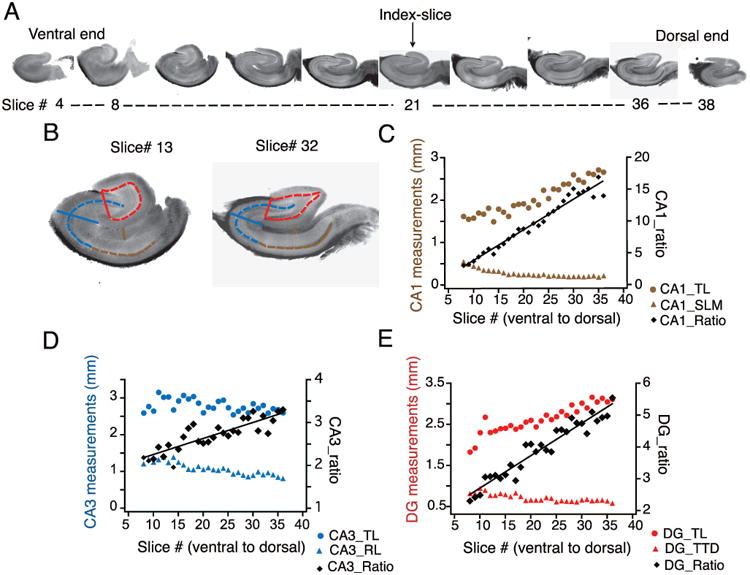
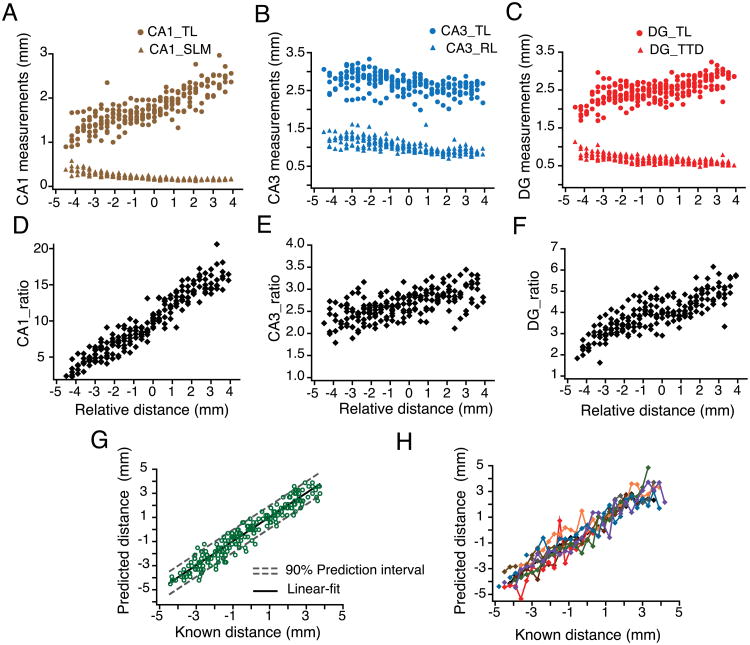
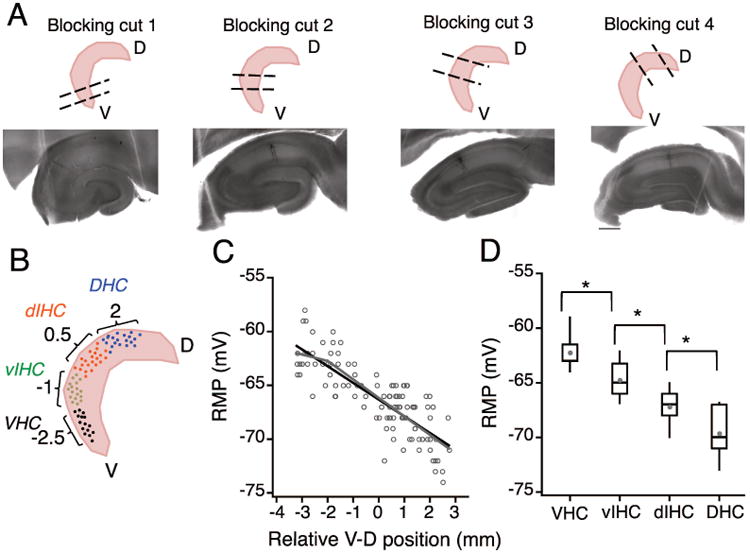
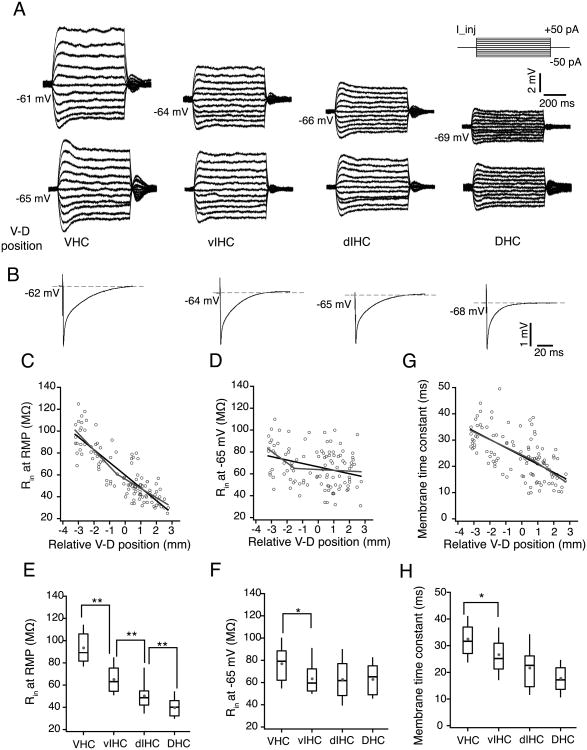
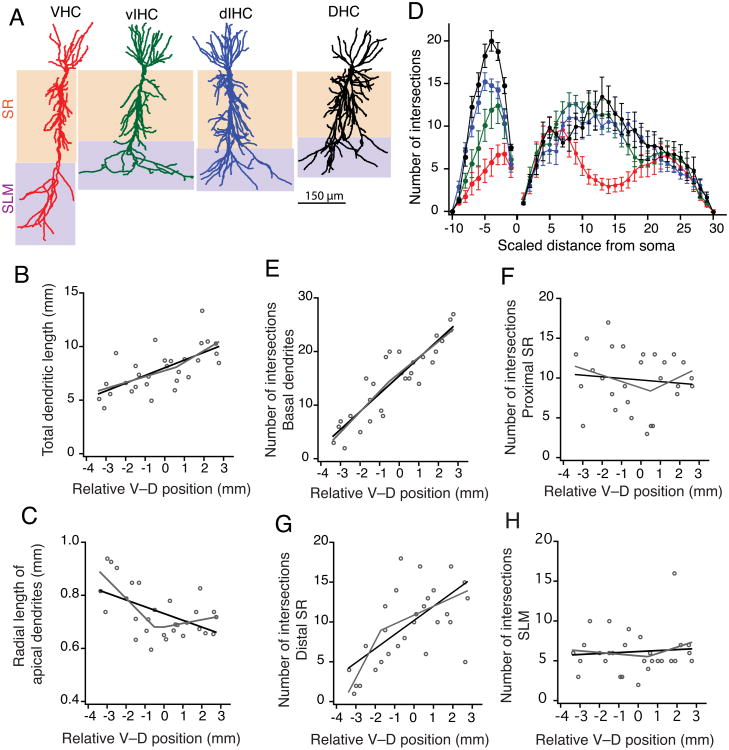
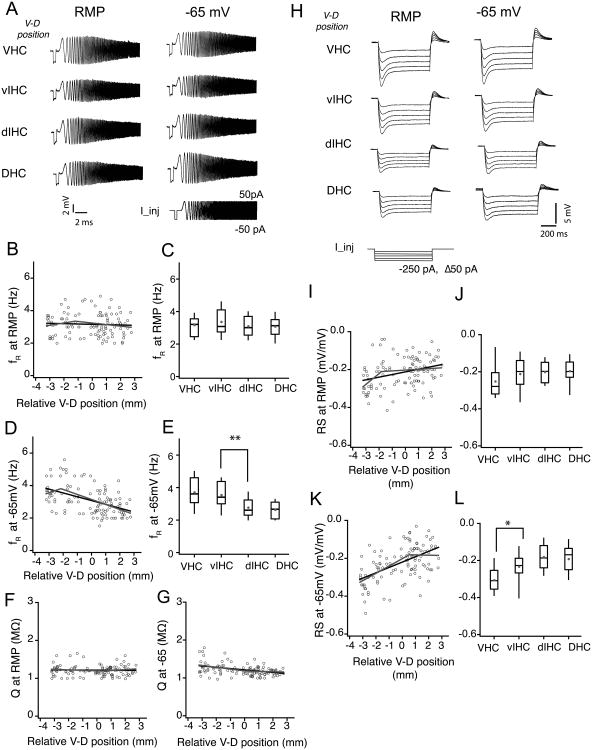
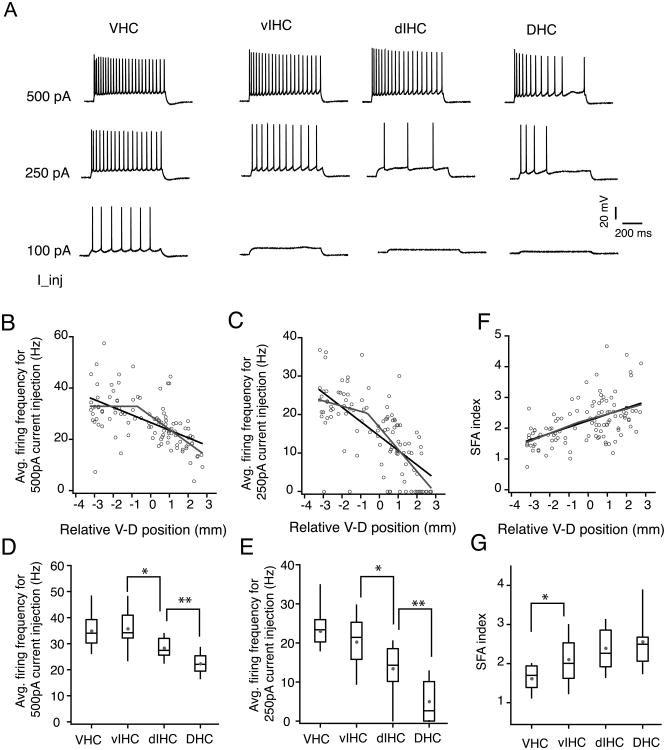
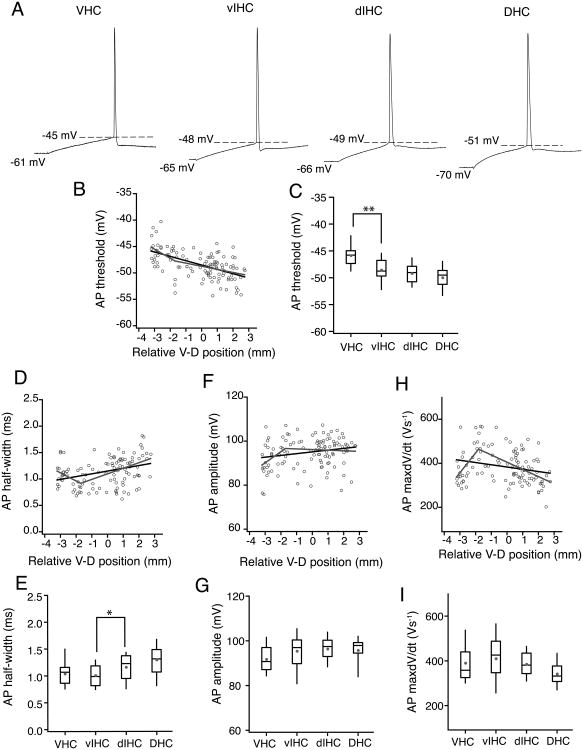
Differences in behavioral roles, anatomical connectivity, and gene expression patterns in the dorsal, intermediate, and ventral regions of the hippocampus are well characterized. Relatively fewer studies have, however, focused on comparing the physiological properties of neurons located at different dorsoventral extents of the hippocampus. Recently, we reported that dorsal CA1 neurons are less excitable than ventral neurons. There is little or no information for how neurons in the intermediate hippocampus compare to those from the dorsal and ventral ends. Also, it is not known whether the transition of properties along the dorsoventral axis is gradual or segmented. In this study, we developed a statistical model to predict the dorsoventral position of transverse hippocampal slices. Using current clamp recordings combined with this model, we found that CA1 neurons in dorsal, intermediate, and ventral hippocampus have distinct electrophysiological and morphological properties and that the transition in most (but not all) of these properties from the ventral to dorsal end is gradual. Using linear and segmented regression analyses, we found that input resistance and resting membrane potential changed linearly along the V-D axis. Interestingly, the transition in resonance frequency, rebound slope, dendritic branching in stratum radiatum, and action potential properties was segmented along the V-D axis. Together, the findings from this study highlight the heterogeneity in CA1 neuronal properties along the entire longitudinal axis of hippocampus.

Keywords: dendritic branching; dorsal hippocampus; firing output; intermediate hippocampus; intrinsic excitability; resonance frequency; ventral hippocampus.


Conflict of interest statement

Conflicts of Interest: none

Figures

Figure 1
Figure 1. Measurement and quantification of the anatomical predictors of slice position in the longitudinal axis
A) Representative images of hippocampal slices obtained from sectioning an entire hippocampus from the ventral to dorsal (V–D) end. Index-slice represents the slice where the morphology of DG granule cell layer changed from U-Shape to V-shape. B) Scheme for measurement of anatomical markers associated with the hippocampal formation depicted using representative slices close to ventral (left, slice # 13) and dorsal end (right, slice # 32): CA1, transverse length (CA1_TL, dashed brown line) and radial length of stratum lacunosum moleculare (CA1_SLM, solid brown line); CA3, transverse length (CA3_TL, dashed blue line) and radial length (CA3_RL, solid blue line); DG, transverse length (DG_TL, dashed red line) and tip-to-tip distance (DG_TTD, solid red line). C-E) Transverse (circles) and radial (triangles) measurements from CA1 (C), CA3 (D) and DG (E) are plotted against the slice number (V–D) for one representative hippocampus. The ratios of the transverse-to-radial dimensions (black diamonds) of CA1 (C), CA3 (D), and DG (E) are plotted against the slice number. There was a significant linear correlation (tested using Pearson correlation coefficient) between the three ratios and slice position (n=27 slices; CA1_ratio: r= 0.98, p<0.01; CA3_ratio: r=0.88, p<0.01; DG_ratio: r=0.97, p<0.01) indicating that these ratios are very good predictors of slice position in the longitudinal axis. Black lines are regression lines.
Figure 2
Figure 2. Linear regression model for predicting hippocampal slice position along the longitudinal axis
A-C) Trends in transverse (circles) and radial (triangles) measurements of CA1 (A), CA3 (B) and DG (C) compiled for all hippocampi (n=9) plotted against the relative ventral to dorsal distance (V–D). The relative distances of each set of hippocampal slices were aligned using the index-slice (represented as zero). D-F) The ratios of the transverse-to-radial dimensions of the CA1 (D), CA3 (E), and DG (F) for all hippocampi were plotted against their relative longitudinal distance from the index-slice. G) CA1, CA3 and DG ratios from (D-F) were used to build a linear regression model according to the following equation: relative distance = β0 + β1 (CA1 ratio) + β2 (DG ratio) + β3 (CA3 ratio). The predicted position of each hippocampal slice is plotted against its known distance (open green circles), resulting in a linear relationship (black line represents the linear fit). Dashed grey lines are best-fit lines to the upper and lower bounds of the prediction interval for each point with 90% confidence. H) Data in (G) are replotted and color-coded to depict predicted and known position for slices from individual hippocampal arrays.
Figure 3
Figure 3. Using the coordinate system to predict longitudinal position of recorded slices
A) Top row: Schematic representation of the four blocking angles used to obtain transverse sections from the ventral (blocking cut one), intermediate (blocking cuts two and three) and dorsal parts of the hippocampus (blocking cut four). Bottom row: Neurobiotin filled CA1 neurons in representative hippocampal sections obtained using the four different blocking angles. Note that the anatomical features of CA1, CA3 and DG are very different in the four example sections. B) Schematic to illustrate binning of recorded CA1 neurons into four groups based on the predicted longitudinal position (calculated using the linear regression model) C) Plot showing the resting membrane potential (RMP) of CA1 neurons against the relative ventral to dorsal (V-D) position of individual neurons. Note that the resting membrane potential (RMP) of CA1 pyramidal neurons was more depolarized at the ventral end and it decreased linearly along the longitudinal axis. There was a significant negative correlation (black regression line) between the RMP of CA1 neurons and the location of neurons along the longitudinal axis (r = -0.82, P<1e-29). Grey lines are the segmented regression fits of RMP values. D) The effect of V-D position on change in RMP of CA1 neurons was analyzed by binning the longitudinal axis into four groups (bin-size: 1.5 mm). Data are presented as whisker box plots displaying median, lower (25%) and upper (75%) quartiles, and whiskers representing 10% and 90% range of the data points. Grey filled circles represent the mean RMP value for every bin. RMP was most depolarized for neurons in VHC and decreased in all the subsequent bins. Resting membrane potential of neurons between all adjacent bins was significantly different (Kruskal-Wallis test, P=3.4e-17; Mann-Whitney U test for comparison among groups, **P<1e-5).
Figure 4
Figure 4. Subthreshold membrane properties of CA1 neurons along the longitudinal axis of hippocampus
A) Representative voltage responses to 800 ms depolarizing and hyperpolarizing current injections (-50 to +50 pA, steps of 10 pA; top right schematic) during somatic whole-cell current clamp recordings from representative CA1 neurons from VHC, vIHC, dIHC and DHC. Top row, voltage responses recorded at the resting membrane potentials (RMP) of individual neurons. The numbers on the left side of the traces indicate the RMP. Note that the RMP of four representative neurons were very different. Bottom row, voltage responses from the same neurons recorded at common membrane potential (-65 mV). B) Representative voltage responses to 1 ms long hyperpolarizing current injection (-400pA) from representative CA1 neurons from four bins of longitudinal axis. C-D and G) Scatter plots for input resistance (Rin at RMP) (C), Rin measured at -65 mV (D) and membrane time constant measured at RMP (G) of CA1 neurons against their relative ventral to dorsal (V–D) position. Black lines are the linear fits. Grey lines are the segmented fits. Significant negative correlation was observed between the Rin (at RMP) of CA1 neurons (r = -0.85, P< 1e-33) and the location of the neurons in V–D axis (C). Input resistance of CA1 neurons measured at -65 mV also decreased from ventral to dorsal end (D) but the correlation was weaker than the correlation of Rin at RMP (r = -0.31, P< 1e-4). There was a significant negative correlation between the time constant (G) and V–D position (r = -0.31, P= 1e-4). E-F and H) Rin (at RMP) (E), Rin (at -65 mV) (F) and membrane time constant (at RMP) (H) for binned V-D positions are shown as whisker box plots displaying median. Grey filled circles are mean values. The Rin (at RMP) values between all adjacent bins were significantly different (Kruskal-Wallis test, P=3.4e-17; Mann-Whitney U test for comparison among groups, **P<1e-5). Rin (at -65mV) was significantly different for the neurons located in VHC as compared to neurons located elsewhere in the longitudinal axis (Kruskal-Wallis test, P=0.004; Mann-Whitney U test for comparison among groups, *P=0.007). Membrane time constant (at RMP) was also significantly different for neurons in VHC (Kruskal-Wallis test, P=6.2e-10; Mann-Whitney U test for comparison among groups, *P<0.01).
Figure 5
Figure 5. Morphological properties of CA1 neurons along the longitudinal axis
A) Morphological reconstructions of representative CA1 neurons from four regions of the longitudinal axis. Layer stratum radiatum (SR) is shaded brown. Layer stratum lacunosum-moleculare (SLM) is shaded purple. B) Total dendritic length of CA1 dendrites increased linearly from ventral to dorsal end. This increase was gradual (linear fit shown as black line) as the segmented regression was not significant (segmented fit shown as grey line). C) Radial length of the apical dendrites decreased from ventral to dorsal end. Change in radial apical length was abrupt as the segmented regression fit (grey line) was significantly better than the linear fit (black line). D) Number of intersections with Sholl spheres is plotted against dendritic distances. Distance between Sholl radii was adjusted so that 30 and 10 spheres described the apical and basal trees, respectively. Basal and apical dendrites of CA1 neurons from VHC had significantly fewer intersections with Sholl spheres than neurons from other regions along the longitudinal axis (Two-way ANOVA, p=7.6e-10). E-H) Scatter plots showing the V–D change in number of intersections with Sholl spheres for basal dendrites (E), in proximal SR region (F), in distal SR region (G), and in SLM (H). Black lines are linear fits and grey lines are segmented fits. Number of intersections in basal dendrites increased gradually from ventral to dorsal end. The increase in number of intersections in proximal and distal SR was segmented. No change in number of intersections in SLM along the longitudinal axis.
Figure 6
Figure 6. Ih sensitive subthreshold membrane properties of CA1 neurons along the longitudinal axis of hippocampus
A) Representative voltage traces illustrating the membrane resonance in response to a chirp stimulus (0-15 Hz, 15 s) during somatic whole-cell current clamp recordings from example CA1 neurons from four bins of the ventral to dorsal (V–D) axis. B, D, F and G) Scatter plots for resonance frequency (fR) measured at RMP (B), fR measured at -65 mV (D) and resonance amplitude (Q) measured at RMP (F) and measured at -65 mV (G) of CA1 neurons against their relative V–D position. There was no correlation between the fR (B) and Q (F) measured at RMP (fR: r=-0.05, P=0.57; Q: r=-0.03, P=0.73). When measured at -65 mV, fR (D) showed a significant negative correlation with V-D distance (black line is linear fit; grey line is segmented fit) and Q (G) also showed a significant negative correlation (r=-0.4, P<1e-5). C, E) Resonance frequency of CA1 neurons measured at RMP and -65 mV was plotted as whisker and box plots showing the median values. Grey circles illustrate the mean values. fR (at RMP) was similar for neurons across the longitudinal axis (C) (Kruskal-Wallis test, P=0.004). fR measured at -65 mV (E) was significantly different for CA1 neurons from VHC and vIHC (Kruskal-Wallis test, P=1.6e-6; Mann-Whitney U test for comparison among groups, **P<0.001). H) Representative voltages responses to hyperpolarizing current injections during somatic whole-cell current clamp recordings from example CA1 neurons from four bins of the V–D axis. I, K) Rebound slope (RS) measured at RMP (I) and at -65 mV (K) for CA1 neurons plotted against the V–D position of individual neurons. Note that the RS measured at -65 mV had a stronger positive correlation with V-D position (r=0.54, P<1e-10) as compared to the RS measured at RMP (r= 0.3, P<1e-4). J, L) RS data are plotted as whisker and box plots showing median values. Grey circles are mean values. RS measured at -65 mV (L) for the neurons in VHC was significantly different from the neurons in the rest of the longitudinal axis (Kruskal-Wallis test, P=1.6e-6; Mann-Whitney U test for comparison among groups, *P<0.01)
Figure 7
Figure 7. Firing output of CA1 neurons along the longitudinal axis of hippocampus
A) Voltage traces showing trains of action potentials fired in response to depolarizing current injections in representative CA1 neurons from four regions of the ventral to dorsal (V–D) axis. B-C) Scatter plots of average firing frequency in response to 500 pA and 250 pA current injections with V–D position of individual neurons. Firing frequencies for both current intensities showed a strong negative correlation with V–D position (500 pA: r=-0.57, P=3.8e-11; 250pA: r=-0.57, P=2.18e-10). Black lines are linear fit and grey lines are segmented fits. D-E) Whisker and box plots showing the median and range of firing frequencies in response to 500 pA and 250pA current injections. Grey circles depict the mean values. Firing frequency for 500 pA current injection (D) was significantly different across the four bins of longitudinal axis (Kruskal-Wallis test, P=4.4-11; Mann-Whitney U test for comparison among groups, *P<0.005, **P<1e-5). Firing frequency for 250 pA current injection (E) was also significantly different across the four bins of longitudinal axis (Kruskal-Wallis test, P=7.1-13; Mann-Whitney U test for comparison among groups, *P<0.005, **P<1e-5). F) Scatter plot of spike frequency accommodation (SFA) index of CA1 neurons across the V-D axis. SFA index of CA1 neurons was positively correlated with the V–D position (r=0.53, P<1e-9). SFA index was significantly different for neurons in VHC (Kruskal-Wallis test, P=3.75-7; Mann-Whitney U test for comparison among groups, *P<0.018).
Figure 8
Figure 8. Single action potential properties of CA1 neurons along the longitudinal axis of hippocampus
A) Individual action potentials (AP) from representative CA1 neurons from four regions of the ventral to dorsal (V–D) axis. Dashed lines indicate the AP threshold. Voltage values in the bottom row indicate the RMP. B, D, F and H) Scatter plots for AP threshold (B), AP half-width (D), AP amplitude (F) and AP maximum dV/dt (H) of CA1 neurons against their relative V–D position. Black lines are the linear regression fits. Grey lines are segmented regressions fits. There was a significant negative correlation of AP threshold with V–D position (r=-0.546, P=5.4e-10). AP half-width showed a slight positive correlation with V–D position (r=0.34, P=2.1e-4). AP amplitude (r=-0.2, P=0.02) and AP max dV/dt (r=-0.23, P=0.015) were not significantly correlated with V-D position. C, E, G and I) Data are plotted as whisker and box plots showing the median values. Grey filled circles denote the mean values. AP threshold (C) was significantly depolarized for the neurons in VHC (Kruskal-Wallis test, P=1.8-8; Mann-Whitney U test for comparison among groups, **P<1e-3). AP half-width (E) was significantly different between the neurons in dorsal half and ventral half of the hippocampus (Kruskal-Wallis test, P=9-4; Mann-Whitney U test for comparison among groups, *P<0.019). The difference across bins in AP amplitude (G) (Kruskal-Wallis test, P=0.03) and AP max dV/dt (I) (Kruskal-Wallis test, P=0.02) was not significant.

References

    1. Akaikea K, Tanakaa S, Tojoa H, Fukumotoa SI, Imamura BSI, Takigawa M. Kainic acid-induced dorsal and ventral hippocampal seizures in rats. Brain Research. 2001;900:65–71. - PubMed
    1. Amaral DG, Witter MP. The three-dimensional organization of the hippocampal formation: A review of anatomical data. Neuroscience. 1989;31:571–591. - PubMed
    1. Ashton D, Van Reempts J, Haseldonckx M, Willems R. Dorsal-ventral gradient in vulnerability of CA1 hippocampus to ischemia: a combined histological and electrophysiological study. Brain Research. 1989;487:368–372. - PubMed
    1. Bannerman DM, Rawlins JNP, McHugh SB, Deacon RMJ, Yee BK, Bast T, Zhang WN, Pothuizen HHJ, Feldon J. Regional dissociations within the hippocampus—memory and anxiety. Neuroscience & Biobehavioral Reviews. 2004;28:273–283. - PubMed
    1. Bast T, Wilson IA, Witter MP, Morris RGM. From rapid place learning to behavioral performance: A key role for the intermediate hippocampus. PLoS Biol. 2009;7:0730–0746. - PMC - PubMed

Publication types

MeSH terms

Substances