. 2015 Sep 3:5:13425.
doi: 10.1038/srep13425.

High-resolution non-contact measurement of the electrical activity of plants in situ using optical recording

Affiliations

High-resolution non-contact measurement of the electrical activity of plants in situ using optical recording

Dong-Jie Zhao et al. Sci Rep. .

Abstract

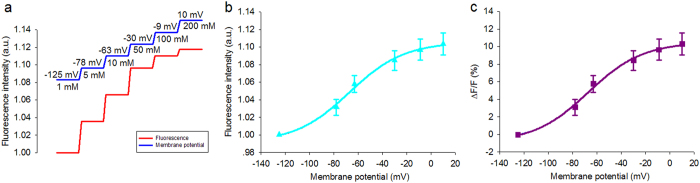
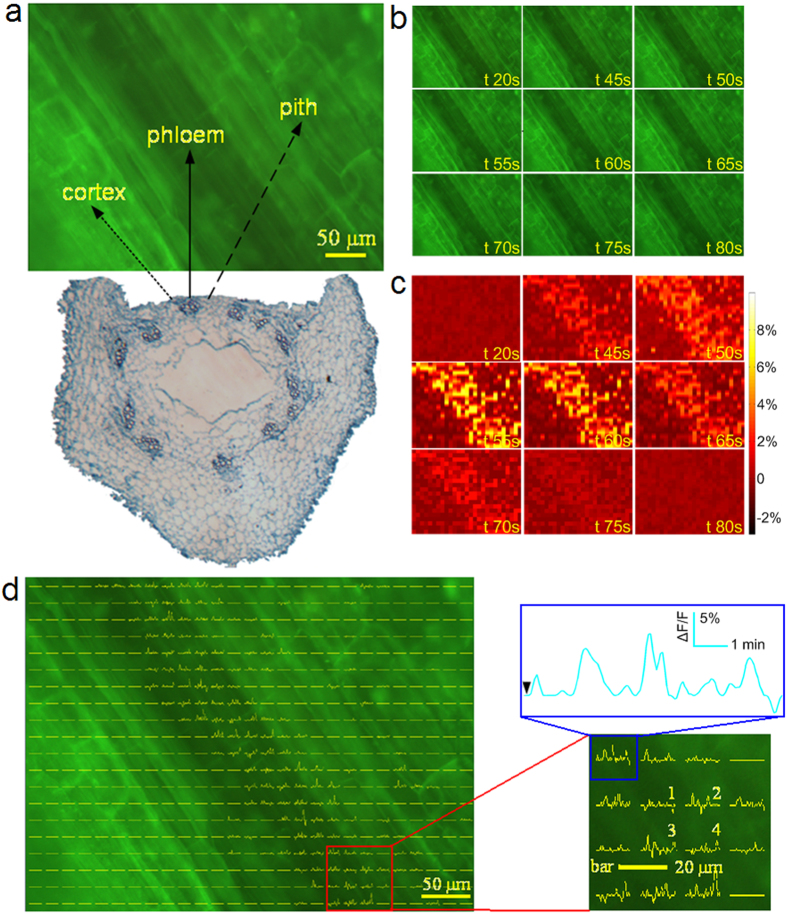
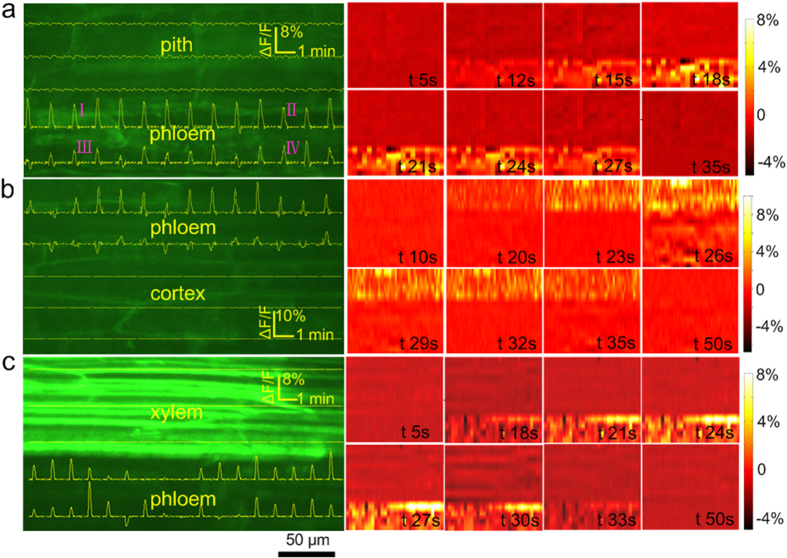
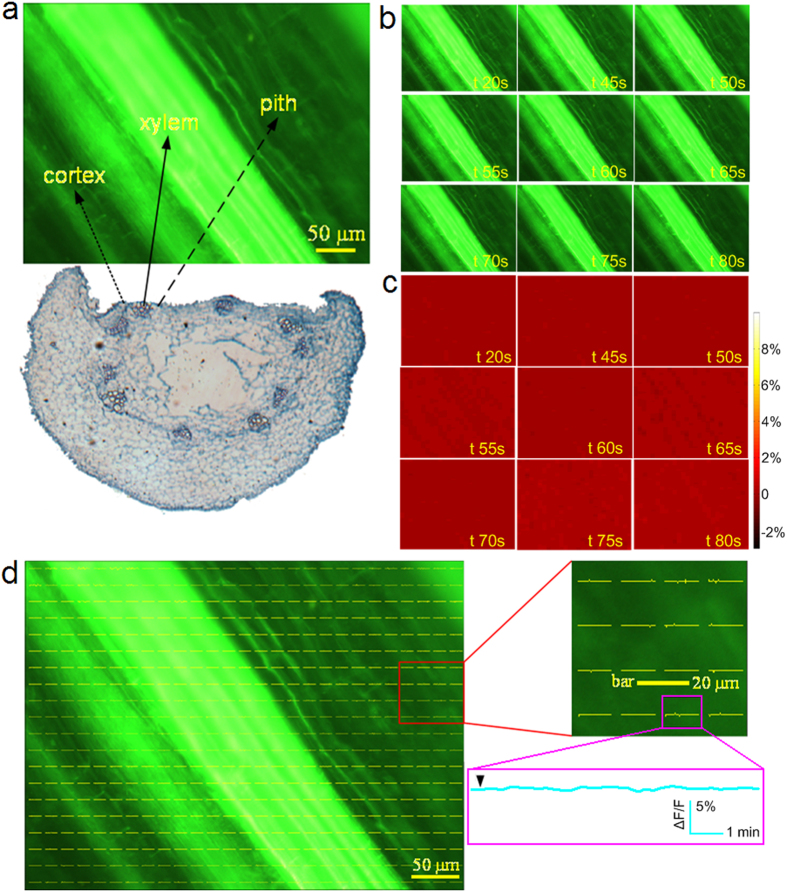
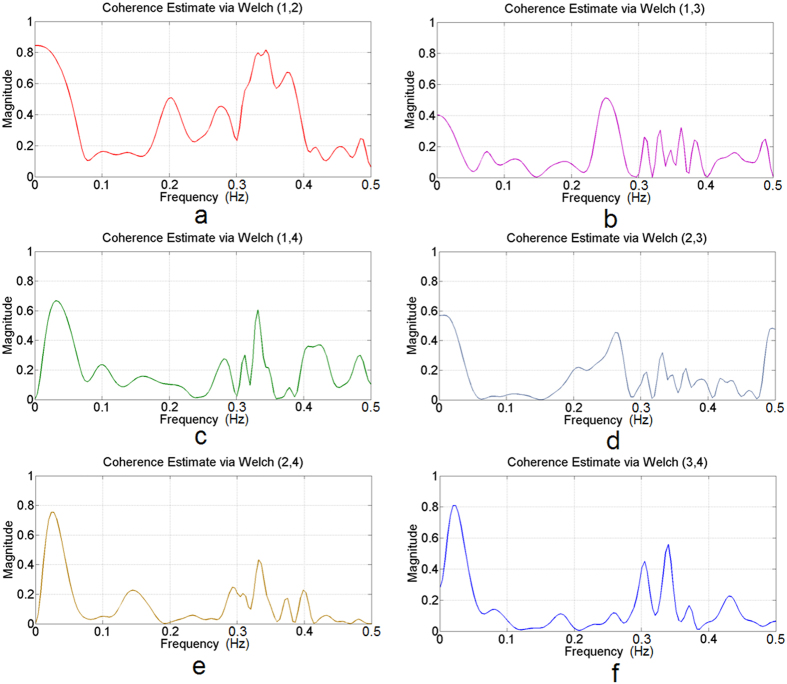
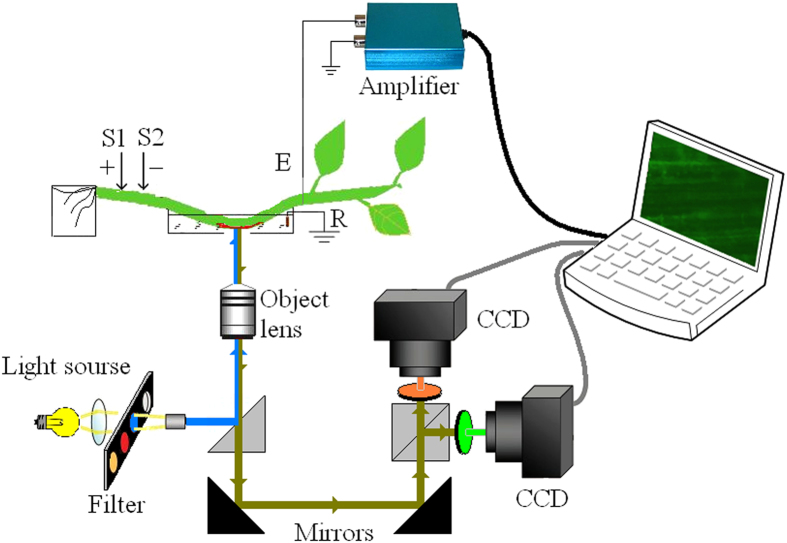
The limitations of conventional extracellular recording and intracellular recording make high-resolution multisite recording of plant bioelectrical activity in situ challenging. By combining a cooled charge-coupled device camera with a voltage-sensitive dye, we recorded the action potentials in the stem of Helianthus annuus and variation potentials at multiple sites simultaneously with high spatial resolution. The method of signal processing using coherence analysis was used to determine the synchronization of the selected signals. Our results provide direct visualization of the phloem, which is the distribution region of the electrical activities in the stem and leaf of H. annuus, and verify that the phloem is the main action potential transmission route in the stems of higher plants. Finally, the method of optical recording offers a unique opportunity to map the dynamic bioelectrical activity and provides an insight into the mechanisms of long-distance electrical signal transmission in higher plants.


Figures

Figure 1
Figure 1. Dye calibration performed in situ in the H. annuus stem and leaf.
(a) The dependence of the fluorescence intensity on the K+-induced membrane potential. The K+ concentrations used were 1 mM, 5 mM, 10 mM, 50 mM, 100 mM and 200 mM and the intracellular recordings by the microelectrode were approximately −125 ± 5 mV, −78 ± 4 mV, −63 ± 4 mV, −30 ± 4 mV, −9 ± 3 mV and 10 ± 1 mV (n = 25 recording repeats, 6 plant samples, mean ± S.E.M.) respectively. (b) The fluorescence ratio, Fc/F, versus the K+-induced membrane potential (n = 6 plant samples, mean ± S.E.M.). (c) The dependence of the normalized fluorescence, ΔF/F, and the membrane potential derived from (b).
Figure 2
Figure 2. Typical optical recording of the distribution of the APs in the phloem region.
(a) The different tissues such as the cortex, phloem and pith are shown in the radial face paraffin sections made at the end of the experiment. (b) A series of consecutive raw fluorescence images. (c) The time lapse ∆F/F images, where the variation of the fluorescence intensity can be clearly observed. (d) The results of the optical recording. The ΔF/F curves from the cortex, phloem and pith indicate that the ΔF/F change appears in the phloem region and that there was no obvious signal in the cortex and pith regions. The maximum amplitude of the ΔF/F signal is shown in the blue rectangle, which was magnified by approximately 8%. In the adjacent regions numbered 1, 2, 3, and 4 with center distances of about 20 μm, the maximum amplitude of the ΔF/F signal was about 5%, 7%, 10% and 4%, respectively.
Figure 3
Figure 3. Typical optical recording of a single AP.
The AP was distributed in the phloem region. (a) The ΔF/F curves are plotted on the left side. Each curve represents the change in the fluorescence intensity of the region around it with a spatial size of about 20 μm × 20 μm. From the signal curves numbered I, II, III and IV, similar ΔF/F waveform and amplitude can be observed, and in the whole region, the maximum amplitude of the ΔF/F signal is about 8%. On the right side, the time lapse ∆F/F images, are presented. The stimulus was applied at the fifth second. Following the stimulus, the ∆F/F change can be clearly observed in the phloem region. (b,c) The ∆F/F curves and the time lapse ∆F/F images of the other two samples. All of the images indicate that the AP is mainly distributed in the phloem region.
Figure 4
Figure 4. Optical recording of different tissues such as the cortex, xylem and pith.
(a) An image of a radial face paraffin section that was made at the end of the experiment showing different tissues such as the cortex, xylem and pith. (b) A series of consecutive raw fluorescence images. (c) Time lapse ∆F/F images. No variation in the fluorescence intensity was observed. (d) The results of the optical recording. There was no ΔF/F change in the cortex, xylem or pith tissues, although the APs were recorded using the Ag/AgCl electrode.
Figure 5
Figure 5. Results of coherence analysis for the different signal regions numbered on the right side of Fig. 2d.
(a) Frequency of coherence between the numbered regions 1 and 2. (b) Frequency of coherence between the numbered regions 1 and 3. (c) Frequency of coherence between the numbered regions 1 and 4. (d) Frequency of coherence between the numbered regions 2 and 3. (e) Frequency of coherence between the numbered regions 2 and 4. (f) Frequency of coherence between the numbered regions 3 and 4. The maximum coherence magnitude (Cohmax) of the signals is nearly 0.8 between signals 1 and 2 in (a). A signal of this magnitude appears in the low frequency range, which is lower than 0.1 Hz. (b–f) The Cohmax values between the different signals are nearly all higher than 0.5, and also appear in the frequency range below 0.1 Hz. Coherence analysis showed that there were high correlations (Cohmax > 0.5, P < 0.005, t-test) in the frequency domain between the different signal regions.
Figure 6
Figure 6. Optical recording system.
Excitation light from a high pressure mercury lamp passed through a band pass excitation filter to irradiate the H. annuus stem immersed in the dye solution. The epifluorescence was passed through the green channel filter, collected by a 20 × NA = 0.40 objective, and then detected using a cooled CCD camera. The fluorescence image was displayed on the computer screen by the control software. The symmetrical design of the CCD camera layout satisfies the requirements of different dyes, but only the green channel CCD was used for DiBAC4(3). S1 and S2 are the stimulating electrodes using 0.1 mm Pt wires. S1 is the anode, E is the Ag/AgCl electrode and R is the reference electrode connected to the ground. This figure was drawn by Zhong-Yi Wang, and the fluorescence image shown in the computer screen was provided by Dong-Jie Zhao.

References

    1. Favre P., Greppin H. & Degli Agosti R. Accession-dependent action potentials in Arabidopsis. J. Plant. Physiol. 168, 653–660 (2011). - PubMed
    1. Zhang X., Yu N., Xi G. & Meng X. Changes in the power spectrum of electrical signals in maize leaf induced by osmotic stress. Chin. Sci. Bull. 57, 413–420 (2012).
    1. Zhao D. J. et al.. Recording extracellular signals in plants: A modeling and experimental study. Math. Comput. Model. 58, 556–563 (2013).
    1. Stolarz M., Król E., Dziubińska H. & Kurenda A. Glutamate induces series of action potentials and a decrease in circumnutation rate in Helianthus annuus. Physiol. Plantarum 138, 329–338 (2010). - PubMed
    1. Chatterjee S. K. et al.. Forward and inverse modelling approaches for prediction of light stimulus from electrophysiological response in plants. Measurement 53, 101–116 (2014).

Publication types

MeSH terms

LinkOut - more resources