

Novel approach for label free super-resolution imaging in far field
- PMID: 26333595
- PMCID: PMC4558609
- DOI: 10.1038/srep13274
Novel approach for label free super-resolution imaging in far field
Abstract
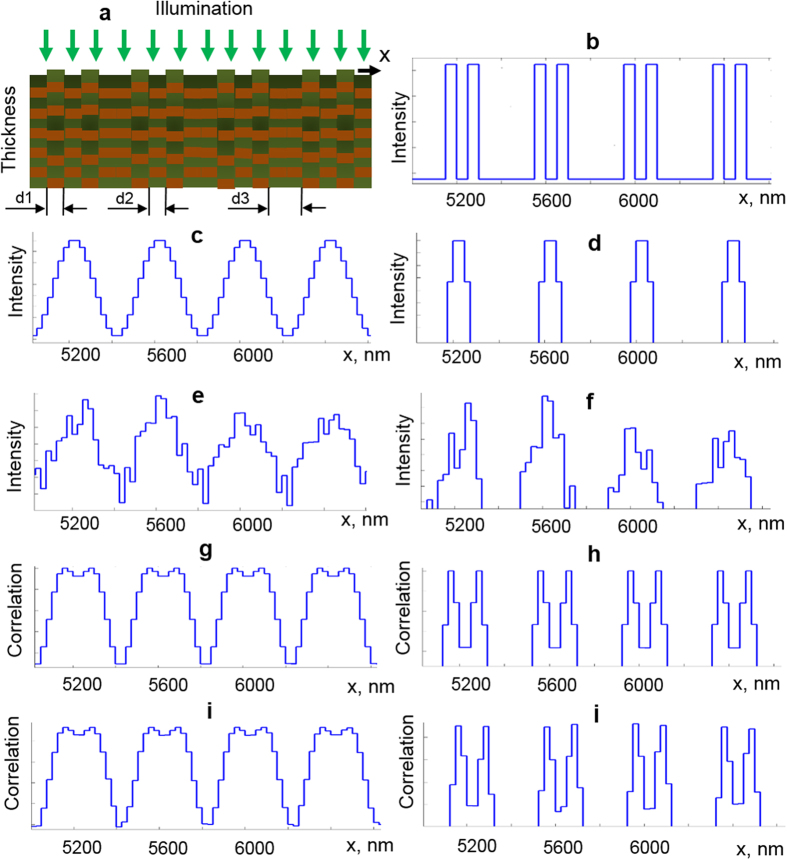
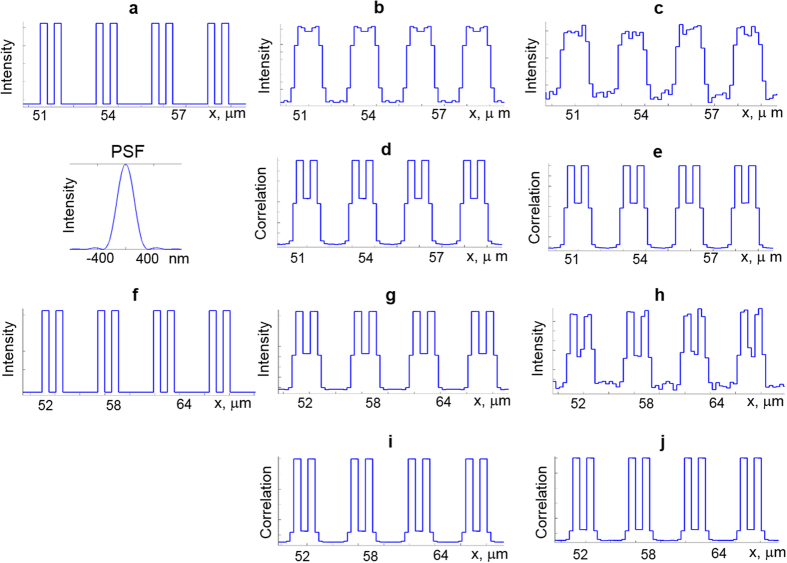
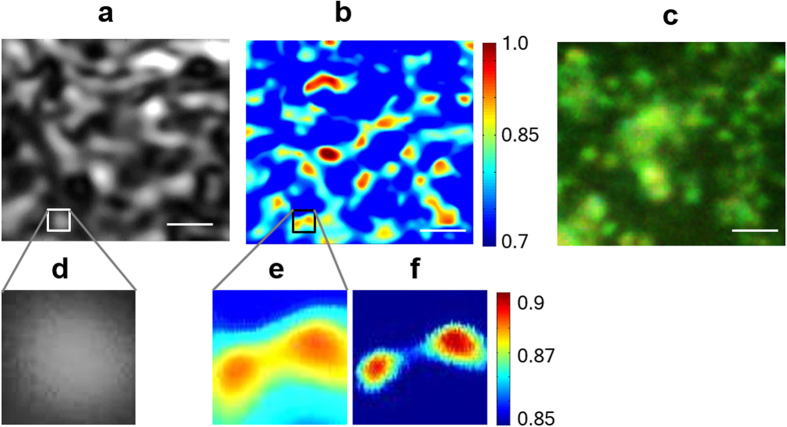
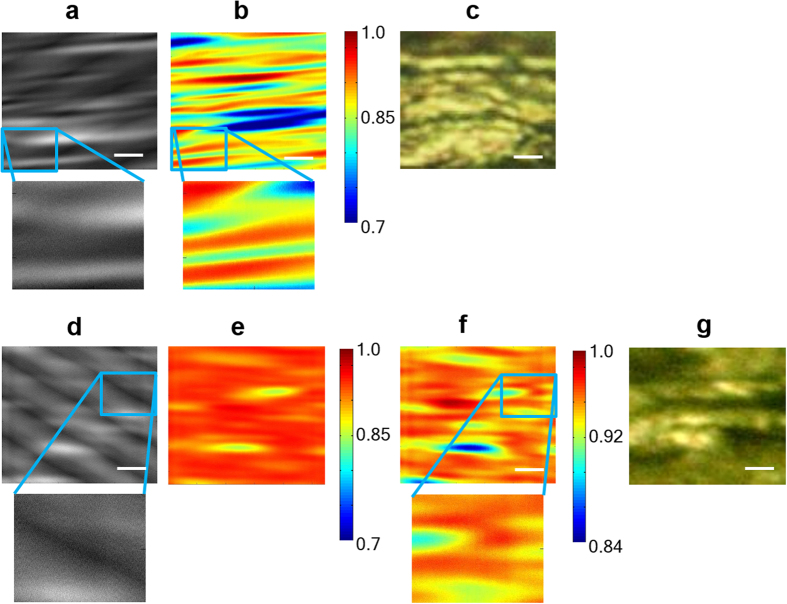
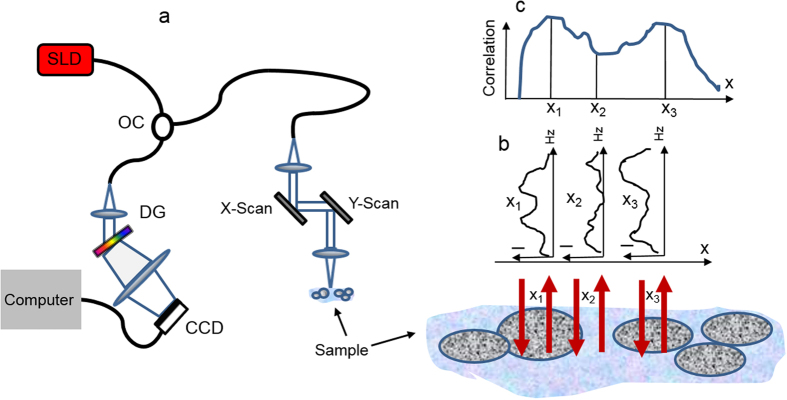
Progress in the emerging areas of science and technology, such as bio- and nano-technologies, depends on development of corresponding techniques for imaging and probing the structures with high resolution. Recently, the far field diffraction resolution limit in the optical range has been circumvented and different methods of super-resolution optical microscopy have been developed. The importance of this breakthrough achievement has been recognized by Nobel Prize for Chemistry in 2014. However, the fluorescence based super-resolution techniques only function with fluorescent molecules (most of which are toxic and can destroy or lead to artificial results in living biological objects) and suffer from photobleaching. Here we show a new way to break the diffraction resolution limit, which is based on nano-sensitivity to internal structure. Instead of conventional image formation as 2D intensity distribution, in our approach images are formed as a result of comparison of the axial spatial frequency profiles, reconstructed for each image point. The proposed approach dramatically increases the lateral resolution even in presence of noise and allows objects to be imaged in their natural state, without any labels.
Figures
References
-
- Hecht B. et al. Scanning near-field optical microscopy with aperture probes: Fundamentals and applications. J Chem Phys 112, 7761–7774 (2000).
-
- Oshikane Y. et al. Observation of nanostructure by scanning near-field optical microscope with small sphere probe. Sci Technol Adv Mat 8, 181–185 (2007).
-
- Kawata S., Inouye Y. & Verma P. Plasmonics for near-field nano-imaging and superlensing. Nat Photonics 3, 388–394 (2009).
-
- Pyne A., Thompson R., Leung C., Roy D. & Hoogenboom B. W. Single-Molecule Reconstruction of Oligonucleotide Secondary Structure by Atomic Force Microscopy. Small 10, 3257–3261 (2014). - PubMed
-
- Lauterbach M. A. Finding, defining and breaking the diffraction barrier in microscopy – a historical perspective. Optical nanoscopy 1, 1–8 (2012).
LinkOut - more resources
Full Text Sources
Other Literature Sources
