

Prevalence of Total Hip and Knee Replacement in the United States
- PMID: 26333733
- PMCID: PMC4551172
- DOI: 10.2106/JBJS.N.01141
Prevalence of Total Hip and Knee Replacement in the United States
Abstract
Background: Descriptive epidemiology of total joint replacement procedures is limited to annual procedure volumes (incidence). The prevalence of the growing number of individuals living with a total hip or total knee replacement is currently unknown. Our objective was to estimate the prevalence of total hip and total knee replacement in the United States.
Methods: Prevalence was estimated using the counting method by combining historical incidence data from the National Hospital Discharge Survey and the Healthcare Cost and Utilization Project (HCUP) State Inpatient Databases from 1969 to 2010 with general population census and mortality counts. We accounted for relative differences in mortality rates between those who have had total hip or knee replacement and the general population.
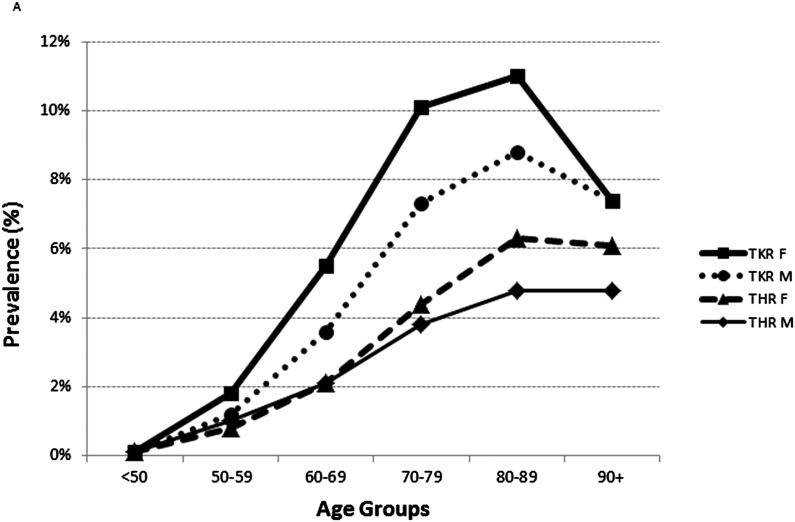
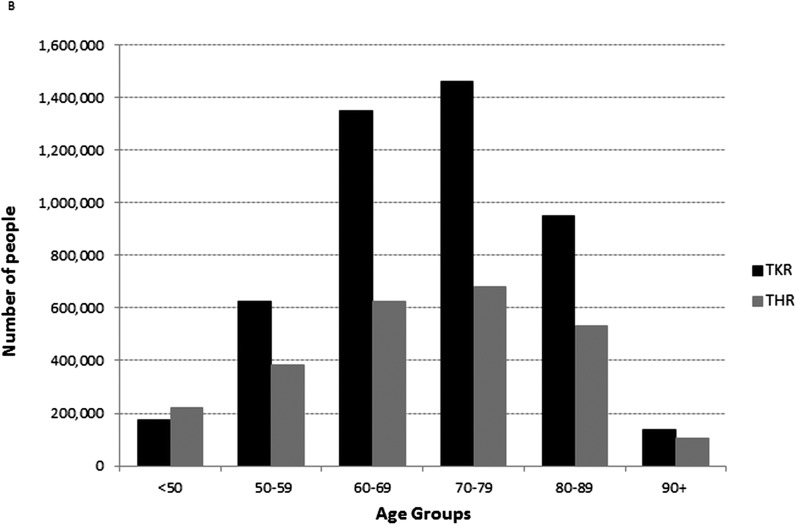
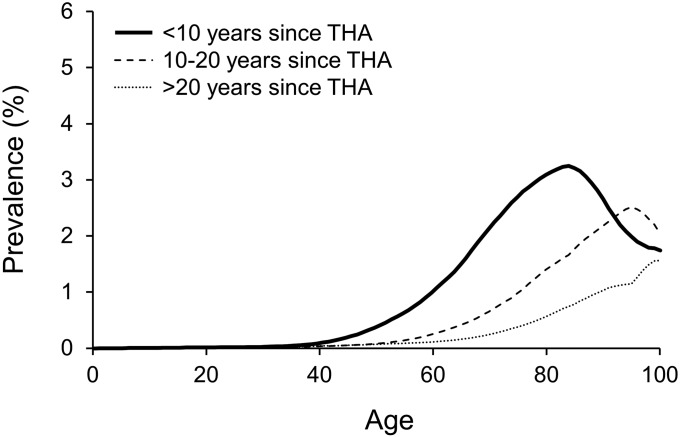
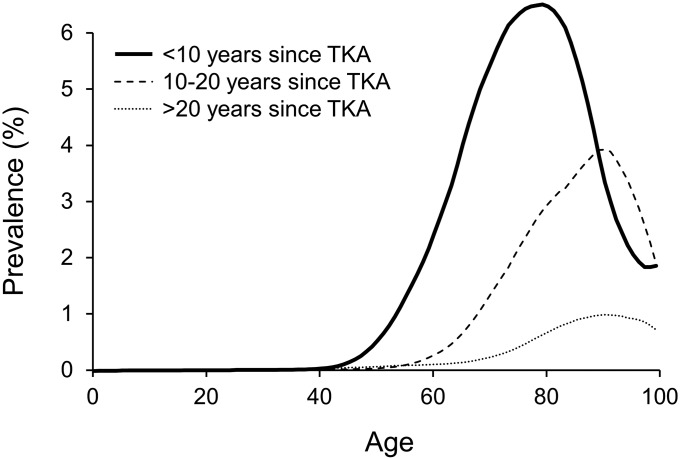
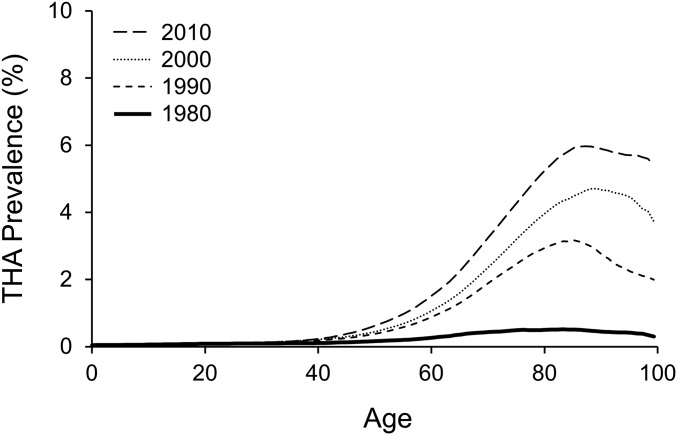
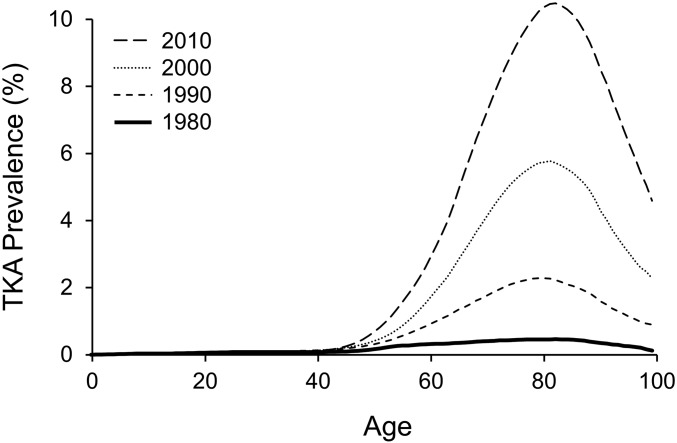
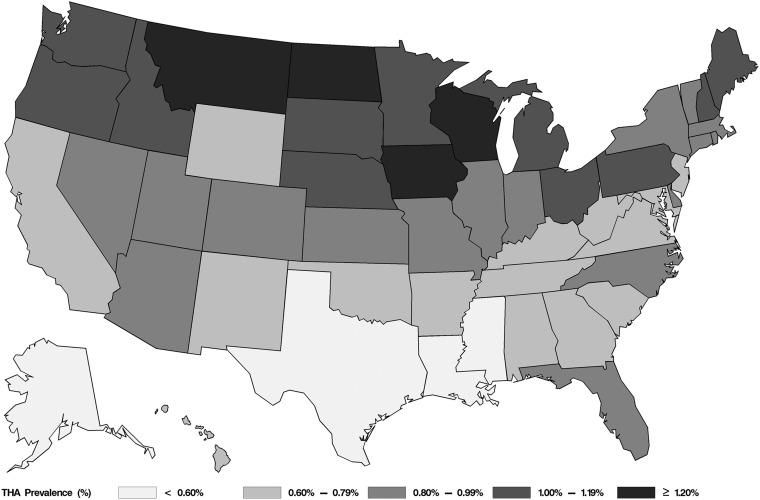
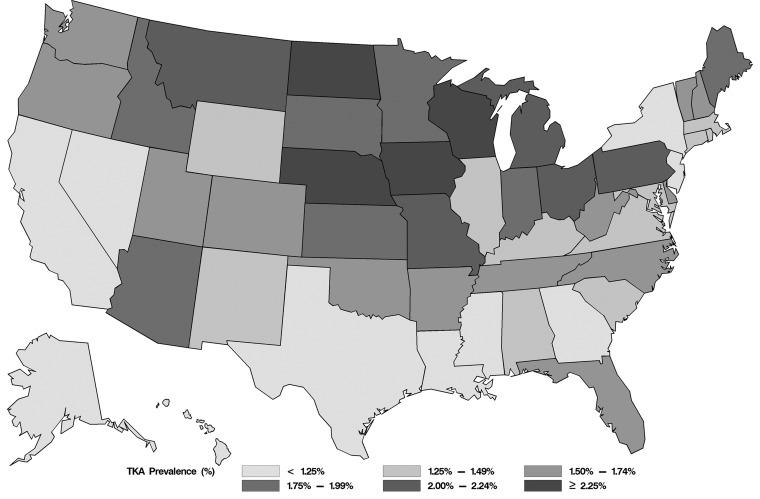
Results: The 2010 prevalence of total hip and total knee replacement in the total U.S. population was 0.83% and 1.52%, respectively. Prevalence was higher among women than among men and increased with age, reaching 5.26% for total hip replacement and 10.38% for total knee replacement at eighty years. These estimates corresponded to 2.5 million individuals (1.4 million women and 1.1 million men) with total hip replacement and 4.7 million individuals (3.0 million women and 1.7 million men) with total knee replacement in 2010. Secular trends indicated a substantial rise in prevalence over time and a shift to younger ages.
Conclusions: Around 7 million Americans are living with a hip or knee replacement, and consequently, in most cases, are mobile, despite advanced arthritis. These numbers underscore the substantial public health impact of total hip and knee arthroplasties.
Copyright © 2015 by The Journal of Bone and Joint Surgery, Incorporated.
Figures
References
-
- Steiner C, Andrews R, Barrett M, Weiss A. HCUP Projections: Mobility/Orthopedic Procedures 2003 to 2012. 2012. HCUP Projections Report # 2012-03. 2012 Sep 20. U.S. Agency for Healthcare Research and Quality. http://hcup-us.ahrq.gov/reports/projections/2012-03.pdf. Accessed 2015 May 27.
-
- Ong KL, Mowat FS, Chan N, Lau E, Halpern MT, Kurtz SM. Economic burden of revision hip and knee arthroplasty in Medicare enrollees. Clin Orthop Relat Res. 2006. May;446(446):22-8. - PubMed
-
- Kurtz S, Ong K, Lau E, Mowat F, Halpern M. Projections of primary and revision hip and knee arthroplasty in the United States from 2005 to 2030. J Bone Joint Surg Am. 2007. April;89(4):780-5. - PubMed
MeSH terms
LinkOut - more resources
Full Text Sources
Other Literature Sources
Medical
