

Magnetic resonance image features identify glioblastoma phenotypic subtypes with distinct molecular pathway activities
- PMID: 26333934
- PMCID: PMC4666025
- DOI: 10.1126/scitranslmed.aaa7582
Magnetic resonance image features identify glioblastoma phenotypic subtypes with distinct molecular pathway activities
Abstract
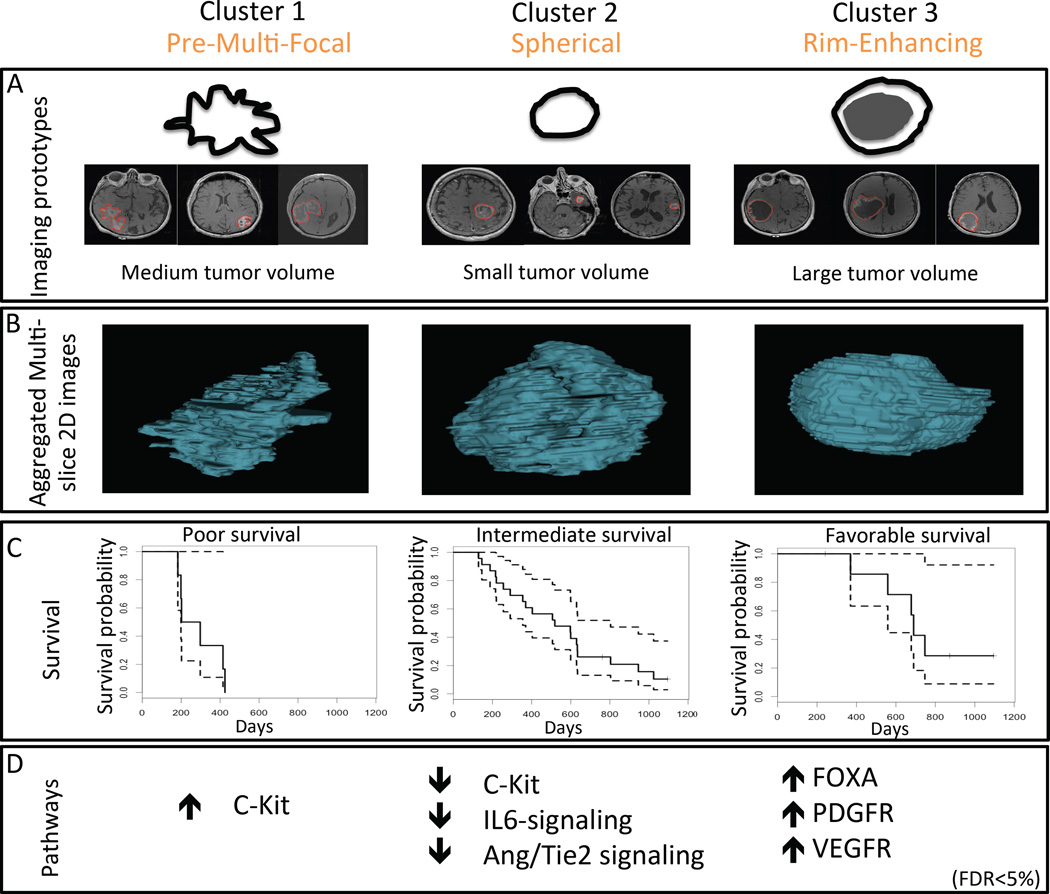
Glioblastoma (GBM) is the most common and highly lethal primary malignant brain tumor in adults. There is a dire need for easily accessible, noninvasive biomarkers that can delineate underlying molecular activities and predict response to therapy. To this end, we sought to identify subtypes of GBM, differentiated solely by quantitative magnetic resonance (MR) imaging features, that could be used for better management of GBM patients. Quantitative image features capturing the shape, texture, and edge sharpness of each lesion were extracted from MR images of 121 single-institution patients with de novo, solitary, unilateral GBM. Three distinct phenotypic "clusters" emerged in the development cohort using consensus clustering with 10,000 iterations on these image features. These three clusters--pre-multifocal, spherical, and rim-enhancing, names reflecting their image features--were validated in an independent cohort consisting of 144 multi-institution patients with similar tumor characteristics from The Cancer Genome Atlas (TCGA). Each cluster mapped to a unique set of molecular signaling pathways using pathway activity estimates derived from the analysis of TCGA tumor copy number and gene expression data with the PARADIGM (Pathway Recognition Algorithm Using Data Integration on Genomic Models) algorithm. Distinct pathways, such as c-Kit and FOXA, were enriched in each cluster, indicating differential molecular activities as determined by the image features. Each cluster also demonstrated differential probabilities of survival, indicating prognostic importance. Our imaging method offers a noninvasive approach to stratify GBM patients and also provides unique sets of molecular signatures to inform targeted therapy and personalized treatment of GBM.
Copyright © 2015, American Association for the Advancement of Science.
Figures


Comment in
-
Magnetic Resonance Imaging to Identify Glioblastoma Molecular Phenotypes.Neurosurgery. 2016 Feb;78(2):N20-1. doi: 10.1227/01.neu.0000479895.10242.9d. Neurosurgery. 2016. PMID: 26779797 No abstract available.
References
-
- Chang SM, Parney IF, Huang W, Anderson FA, Jr, Asher AL, Bernstein M, Lillehei KO, Brem H, Berger MS, Laws ER. Patterns of care for adults with newly diagnosed malignant glioma. Jama. 2005;293:557–564. - PubMed
-
- Vanderbilt-Ingram Cancer Center. clinicaltrials.gov. Vanderbilt-Ingram Cancer Center; 2013. 3T MRI Biomarkers of Glioma Treatment Response.
-
- Massachusetts General Hospital. clinicaltrials.gov. Massachusetts General Hospital; 2013. Bevacizumab with temozolomide PET and vascular MRI for GBM.
-
- Laws ER, Parney IF, Huang W, Anderson F, Morris AM, Asher A, Lillehei KO, Bernstein M, Brem H, Sloan A, Berger MS, Chang S. Survival following surgery and prognostic factors for recently diagnosed malignant glioma: data from the Glioma Outcomes Project. Journal of Neurosurgery. 2003;99:467–473. - PubMed
-
- Hegi ME, Liu L, Herman JG, Stupp R, Wick W, Weller M, Mehta MP, Gilbert MR. Correlation of O6-methylguanine methyltransferase (MGMT) promoter methylation with clinical outcomes in glioblastoma and clinical strategies to modulate MGMT activity. Journal of clinical oncology : official journal of the American Society of Clinical Oncology. 2008;26:4189–4199. - PubMed
Publication types
MeSH terms
Grants and funding
LinkOut - more resources
Full Text Sources
Other Literature Sources
Medical
