. 2015 Nov;114(5):2649-60.
doi: 10.1152/jn.00669.2015. Epub 2015 Sep 2.

Impact of cercal air currents on singing motor pattern generation in the cricket (Gryllus bimaculatus DeGeer)

Affiliations

Impact of cercal air currents on singing motor pattern generation in the cricket (Gryllus bimaculatus DeGeer)

Pedro F Jacob et al. J Neurophysiol. 2015 Nov.

Abstract

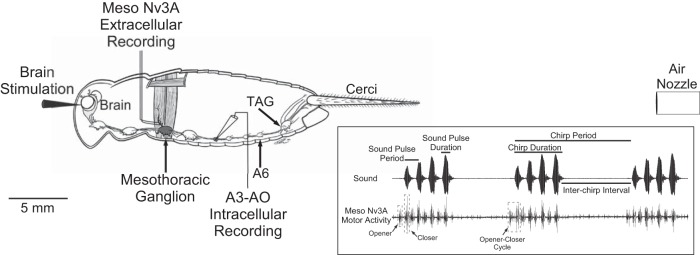
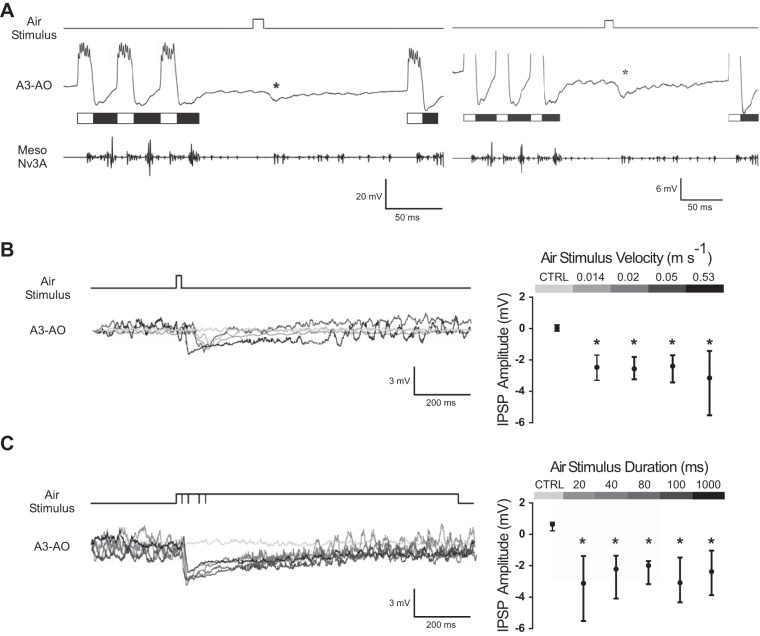
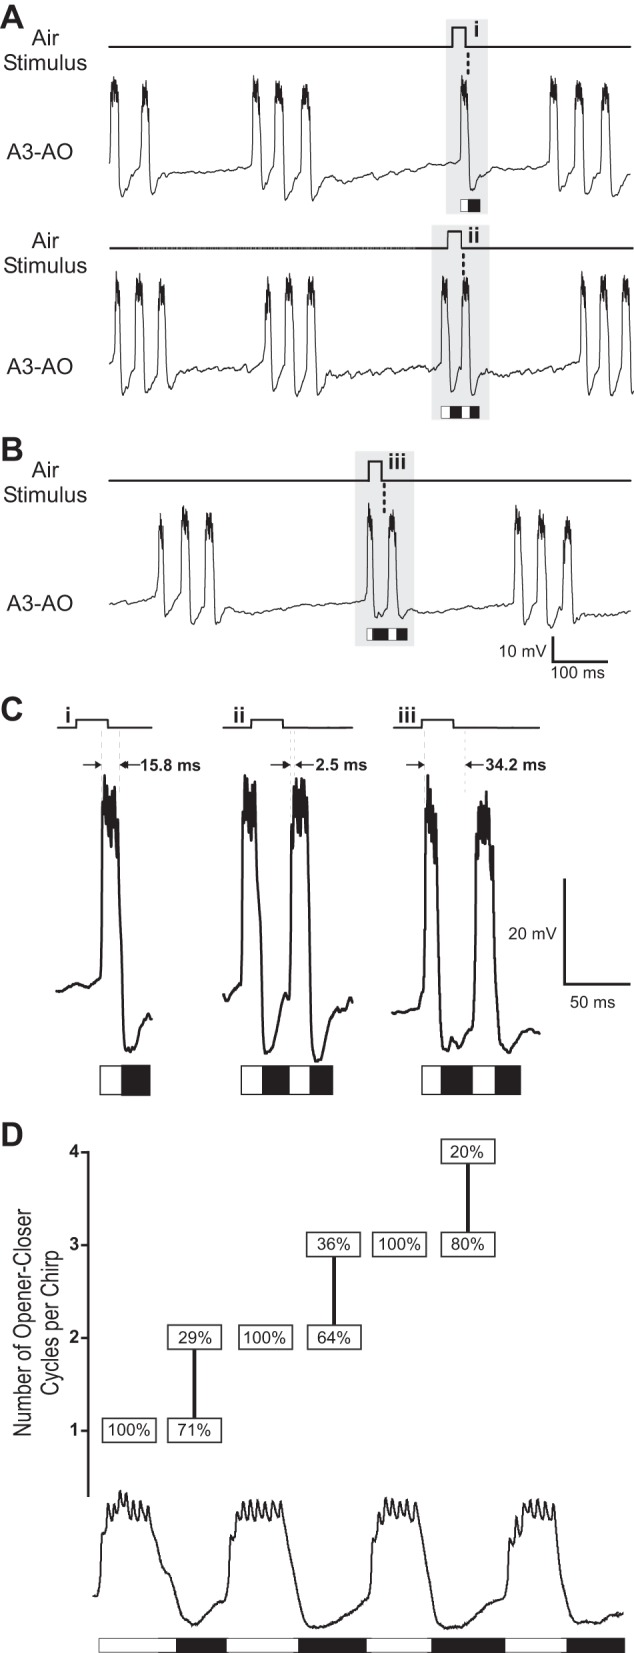
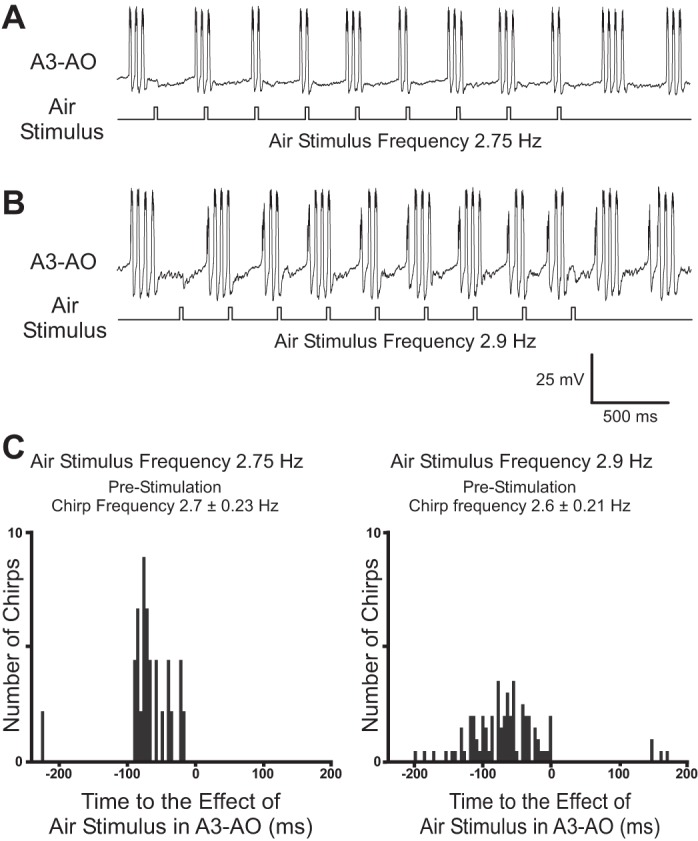
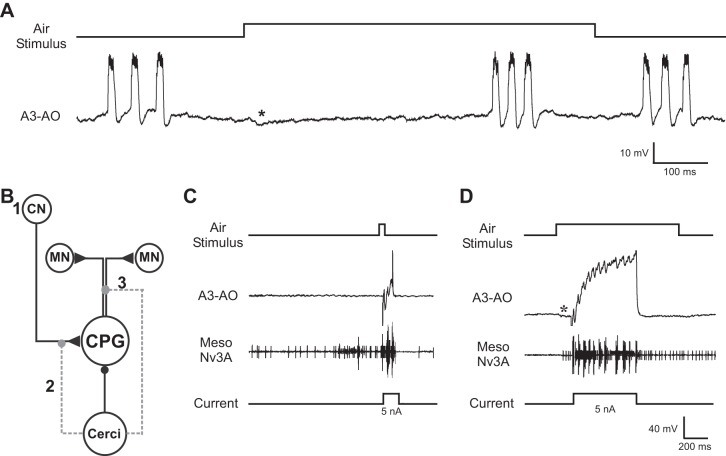
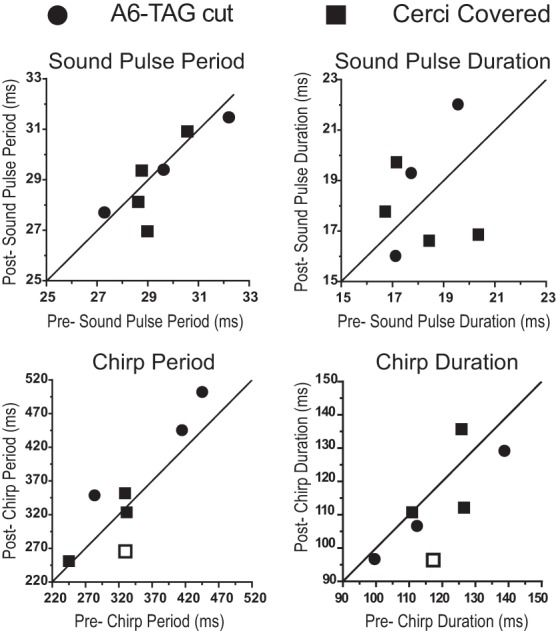
The cercal system of crickets detects low-frequency air currents produced by approaching predators and self-generated air currents during singing, which may provide sensory feedback to the singing motor network. We analyzed the effect of cercal stimulation on singing motor pattern generation to reveal the response of a singing interneuron to predator-like signals and to elucidate the possible role of self-generated air currents during singing. In fictive singing males, we recorded an interneuron of the singing network while applying air currents to the cerci; additionally, we analyzed the effect of abolishing the cercal system in freely singing males. In fictively singing crickets, the effect of short air stimuli is either to terminate prematurely or to lengthen the interchirp interval, depending on their phase in the chirp cycle. Within our stimulation paradigm, air stimuli of different velocities and durations always elicited an inhibitory postsynaptic potential in the singing interneuron. Current injection in the singing interneuron elicited singing motor activity, even during the air current-evoked inhibitory input from the cercal pathway. The disruptive effects of air stimuli on the fictive singing pattern and the inhibitory response of the singing interneuron point toward the cercal system being involved in initiating avoidance responses in singing crickets, according to the established role of cerci in a predator escape pathway. After abolishing the activity of the cercal system, the timing of natural singing activity was not significantly altered. Our study provides no evidence that self-generated cercal sensory activity has a feedback function for singing motor pattern generation.

Keywords: air stimulus; cercal sensory system; escape response; singing central pattern generator interneuron.


Figures

Fig. 1.
Fig. 1.
Schematic diagram of the experimental design with the cricket central nervous system (CNS). Indicated is the site of the eserine injection into the brain, the mesothoracic wing-nerve recording (Meso Nv3A), the intracellular recording of neuron A3-AO in abdominal ganglion A3, the air current stimulation with a nozzle placed 20 mm behind the cerci, producing an air current from the back to the front of the animal, the A6 ganglion, and the terminal ganglion (TAG). Inset: schematic representation of a cricket calling song with 3 chirps composed of 4 sound pulses each and its putative corresponding wing-opener and wing-closer motoneuron activity in Nv3A. The opener-closer cycle refers to 1 sequence of opener-closer activity. The song parameters analyzed (sound pulse period, sound pulse duration, chirp period, chirp duration) are indicated.
Fig. 2.
Fig. 2.
Rhythmic motor activity and synaptic response of the A3-AO interneuron to air currents delivered to the cerci during fictive singing. White and black bars indicate the opener and closer phases of the A3-AO activity, respectively. A: example of the inhibitory postsynaptic potential (IPSP; indicated by asterisks) in the A3-AO to a 20-ms air stimulus presented in the interchirp interval. The air-evoked IPSP is smaller than the inhibition occurring during the closer phase (black bars). Vertical scale bars refer only to the intracellular recording of A3-AO. B, left: applying air stimuli of different velocities leads to similar IPSP amplitudes, although with longer IPSPs for faster stimuli; light gray line represents the membrane potential of the A3-AO where no stimulus was applied. Right: median and interquartile range (IQR; 25th and 75th percentiles) of the inhibitory response to the control (CTRL; average membrane potential 100 ms prior to all stimuli) and different stimuli velocities (N = 3 and n = 90 for low-velocity stimuli and N = 5 and n = 50 for high-velocity stimuli; *P < 0.05) are shown. C, left: applying air stimuli of different durations induces similar IPSPs; light gray line represents the membrane potential of the A3-AO where no stimulus was applied. Right: median and IQR (25th and 75th percentiles) of the inhibitory response to the control (average membrane potential 100 ms prior to all stimuli) and different stimuli durations (N = 5 and n = 50 for 20- and 80-ms stimuli durations and N = 7 and n = 70 for 40-, 100-, and 1,000-ms stimuli durations; *P < 0.05) are shown. In B and C, the inhibition amplitude was calculated from the difference between the average membrane potential 100 ms prior to the stimulus and the maximum inhibition. In the averaged membrane potential, oscillations of the signal are due to rhythmic A3-AO activity, when the crickets resumed singing after the air stimulus.
Fig. 3.
Fig. 3.
A3-AO activity during fictive singing and responding to 20-ms air current stimuli delivered to the cerci. A: examples of stimuli occurring during an ongoing chirp (top), during the beginning of the interchirp interval (middle), and at the time when a chirp is expected to occur (bottom). Inhibition of the A3-AO is indicated by *. B: phase response diagram of the chirp pattern in relation to the effect of the air stimuli (N = 9, n = 103). Tn−1, chirp period before air stimulation; t, time from beginning of the chirp to time of the stimulation effect on the A3-AO (i.e., 29 ms after onset of air stimulus); Tn, chirp period after air stimuli. Filled circles represent the effect of stimuli falling within the chirp; the end of the chirp is indicated by vertical dashed line. Open circles represent the effect of air stimuli during the interchirp interval; vertical solid line represents beginning of the next chirp. A value of 1 indicates that the chirp period was not altered by the air pulse (horizontal dashed line). Gray circles in the diagram correspond to the examples in A.
Fig. 4.
Fig. 4.
Effect of 20-ms air stimuli within a chirp. A: if the effect of the stimulus falls within the opener phase (white bars), the chirp is always prematurely terminated. B: if the effect of the stimulus occurs within the closer phase (black bars), the next opener-closer cycle is still produced. In A and B, stippled line indicates time of stimulus effect in A3-AO after onset of air stimulus (i.e., 29 ms). C: higher temporal and amplitude resolution of the stimulus effect in A3-AO (i–iii; gray areas in A and B). The time between the first spike of the preceding opener burst and the stimulus effect (i.e., 29 ms) is indicated by 2 vertical dashed lines with the corresponding interval in milliseconds. D: y-axis represents number of opener-closer cycles produced while an air stimulus was delivered during the chirp. Boxes indicate % of opener-closer cycles per chirp generated depending on the timing of the air-evoked inhibition within the opener (N = 4, n = 53) or closer (N = 4, n = 65) phase as indicated by white (opener) and black (closer) bars. Note that the calling song analyzed did not have more than 4 opener-closer cycles; stimuli occurring during the 4th cycle were not considered.
Fig. 5.
Fig. 5.
A and B: intracellular recording of A3-AO in a fictively singing cricket while periodic air stimuli were applied at a frequency of 2.75 Hz (A) or 2.9 Hz (B). C: peristimulus time histograms for the 2 stimulation frequencies. Diagrams are aligned to the onset (0 ms) of the air-evoked IPSP; for 2.75 Hz: 26 chirps and 45 stimuli (N = 1); for 2.9 Hz: 93 chirps and 198 stimuli (N = 1).
Fig. 6.
Fig. 6.
Depolarizing current injection into A3-AO during inhibition elicited by air current stimulation. A: a 1,000-ms stimulus delivered to the cerci during the interchirp interval elicits an IPSP (*) and extends the interval. B: diagram of the putative cricket singing network. When singing, the central pattern generator (CPG) is excited (triangle) by the calling song brain command neuron (CN) and drives the motor neuron network (MN). Air stimulation of the cerci forwards an inhibition (circle) to the CPG. The cercal inhibition does not modulate the activity of the CN (1), but it may alter either the connection between the CN and CPG (2) or the connection between the CPG and MN network (3). C: a 20-ms air stimulus elicits inhibition in the opener interneuron. Injection of 100-ms, +5-nA depolarizing current pulse during the inhibition evokes rhythmic singing motor activity in A3-AO and the mesothoracic motoneurons. Vertical scale bars refer only to intracellular recording of A3-AO. D: application of a 1,000-ms air stimulus and injection of a 500-ms depolarizing current (+5 nA) during the stimulus-evoked IPSP (*) elicits rhythmic singing activity in A3-AO and the motoneurons of the wing nerve. Note that the Meso Nv3A recording also represents breathing motor activity. Vertical scale bars refer only to intracellular recording of A3-AO.
Fig. 7.
Fig. 7.
Effect of blocking cercal sensory activity on calling song parameters in freely singing male Gryllus bimaculatus (N = 7). Analysis of different song parameters, as indicated in Fig. 1, in freely singing crickets before (x-axis) and after (y-axis) the connectives between A6 and TAG were cut (N = 3, circles) and the cerci were covered (N = 4, squares). Each symbol represents the mean for 1 individual animal, before and after the block of cercal sensory activity, and the line through the origin represents the situation where the pre and post measures have the same mean parameter value. Open squares represent 1 animal with cerci covered, where the 2-way ANOVA revealed a significant interaction between manipulation and animal factors.

Similar articles

Cited by

References

    1. Andersson O, Forssberg H, Grillner S, Wallén P. Peripheral feedback mechanisms acting on the central pattern generators for locomotion in fish and cat. Can J Physiol Pharmacol 59: 713–726, 1981. - PubMed
    1. ASAB Ethics Committee. Guidelines for the treatment of animals in behavioural research and teaching. Anim Behav 71: 245–253, 2006. - PubMed
    1. Baba Y, Shimozawa T. Diversity of motor responses initiated by a wind stimulus in the freely moving cricket, Gryllus bimaculatus. Zoolog Sci 14: 587–594, 1997.
    1. Bässler U. Afferent control of walking movements in the stick insect Cuniculina impigra. J Comp Physiol A 158: 351–362, 1986.
    1. Bellman KL, Krasne FB. Adaptive complexity of interactions between feeding and escape in crayfish. Science 221: 779–781, 1983. - PubMed

Publication types

LinkOut - more resources