. 2016 Mar;27(3):745-65.
doi: 10.1681/ASN.2014111136. Epub 2015 Sep 2.

Low-Dose IL-17 Therapy Prevents and Reverses Diabetic Nephropathy, Metabolic Syndrome, and Associated Organ Fibrosis

Affiliations

Low-Dose IL-17 Therapy Prevents and Reverses Diabetic Nephropathy, Metabolic Syndrome, and Associated Organ Fibrosis

Riyaz Mohamed et al. J Am Soc Nephrol. 2016 Mar.

Abstract

Diabetes is the leading cause of kidney failure, accounting for >45% of new cases of dialysis. Diabetic nephropathy is characterized by inflammation, fibrosis, and oxidant stress, pathologic features that are shared by many other chronic inflammatory diseases. The cytokine IL-17A was initially implicated as a mediator of chronic inflammatory diseases, but recent studies dispute these findings and suggest that IL-17A can favorably modulate inflammation. Here, we examined the role of IL-17A in diabetic nephropathy. We observed that IL-17A levels in plasma and urine were reduced in patients with advanced diabetic nephropathy. Type 1 diabetic mice that are genetically deficient in IL-17A developed more severe nephropathy, whereas administration of low-dose IL-17A prevented diabetic nephropathy in models of type 1 and type 2 diabetes. Moreover, IL-17A administration effectively treated, prevented, and reversed established nephropathy in genetic models of diabetes. Protective effects were also observed after administration of IL-17F but not IL-17C or IL-17E. Notably, tubular epithelial cell-specific overexpression of IL-17A was sufficient to suppress diabetic nephropathy. Mechanistically, IL-17A administration suppressed phosphorylation of signal transducer and activator of transcription 3, a central mediator of fibrosis, upregulated anti-inflammatory microglia/macrophage WAP domain protein in an AMP-activated protein kinase-dependent manner and favorably modulated renal oxidative stress and AMP-activated protein kinase activation. Administration of recombinant microglia/macrophage WAP domain protein suppressed diabetes-induced albuminuria and enhanced M2 marker expression. These observations suggest that the beneficial effects of IL-17 are isoform-specific and identify low-dose IL-17A administration as a promising therapeutic approach in diabetic kidney disease.

Keywords: chronic kidney disease; cytokines; diabetic; diabetic nephropathy; glomerulopathy.


Figures

Figure 1.
Figure 1.
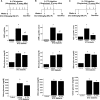
IL-17A gene deletion exacerbates diabetic nephropathy in mice. Diabetes was induced by administering a single dose of STZ, and 12 weeks after induction of diabetes, animals were euthanized and tissues were processed for histopathologic evaluation. (A) Blood glucose in WT and IL-17A knockout (KO) mice. *P<0.001 versus control. (B) Renal function was determined by measuring BUN. **P<0.05 versus other groups. (C) Albumin excretion rate (AER) in WT and IL-17A KO diabetic mice. *P<0.05 versus control; #P<0.05 versus WT diabetic. (D) Albumin excretion normalized to milligrams of creatinine. *P<0.05 versus control; #P<0.05 versus WT diabetic. (E) Glucose excretion in urine. *P<0.05 versus control. (F) Kidney weight-to-body weight (KW/BW) ratio in WT and IL-17A KO mice. *P<0.05 versus control; #P<0.05 versus WT diabetic. (G–J Masson trichrome staining for fibrosis. WT control kidney (G), IL-17A KO control kidney (H), WT diabetic kidney (I), and IL-17A KO diabetic kidney (J). Scale bar=100 µM. (K) Quantification of mesangial expansion. Error bars, mean±SEM. *P<0.05 versus control; #P<0.05 versus WT diabetic. n=10.
Figure 2.
Figure 2.
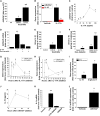
IL-17A administration treats, prevents, and reverses diabetic nephropathy in mice. Diabetes was induced by administering a single dose of STZ; control animals received citrate buffer. (A) IL-17A treatment protocol for diabetic mice wherein diabetic mice received vehicle or IL-17A (10 ng per animal, every 48 hours) for 12 weeks. (B) Prevention protocol for diabetic mice wherein diabetic animals received vehicle or IL-17A (10 ng per animal every 48 hours) for the first 6 weeks and was then stopped. (C) Reversal protocol for diabetic mice wherein diabetic animals received vehicle or IL-17A (10 ng per animal, every 48 hours) starting 6 weeks after confirmation of diabetes and was then continued for another 6 weeks. Albumin excretion rate (AER), blood glucose, and urine glucose were quantified at 13 weeks after STZ administration. Albumin excretion was expressed as μg/24-hour urine. *P<0.05 versus control; #P<0.05 versus vehicle-treated diabetic animals. n=12–16.
Figure 3.
Figure 3.
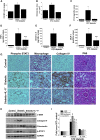
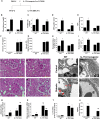
IL-17A treatment suppressed nephropathy and interstitial fibrosis. Mice with IL-17A treatment protocol (as shown in Figure 2A) where further characterized. (A) Kidney weight-to-body weight ratio. (B) Quantification of glomerular area. (C) Interferon gamma-induced protein 10 (IP-10) (D) TNF-α excretion in urine. (E) IL-6 excretion in urine. (F) Monocyte chemoattractant protein-1 excretion in urine. *P<0.05 versus other groups; #P<0.001 versus vehicle-treated diabetic group. n=8–10 in each group. (G) Representative kidney histology showing phospho-stat3, macrophage infiltration, collagen IV expression, and PAS (indicating tubular injury and mesangial expansion). Scale bar=100 µM. (H) Western blot analysis showing expression of matrix proteins α-smooth muscle actin (αSMA), fibronectin, and type IV collagen, and phospho stat3 (p-STAT3). Glyceraldehyde 3-phosphate dehydrogenase (GAPDH) expression was used for normalization of protein loading. (I) Quantification of Western blot in panel H by densitometric analysis. *P<0.01 versus other groups. n=3–5.
Figure 4.
Figure 4.
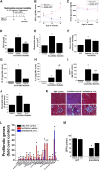
IL-17A administration treats established nephropathy in a genetic model of type 1 diabetes. (A) IL-17A administration protocol in Ins2Akita mutant mice. (B) Albumin excretion rate (AER). (C) Glucose excretion in urine. (D) BUN. (E) Glomerular area. (F) Mean arterial BP measured by radio telemetry. (G) Inducible protein-10 (IP-10) excretion in urine. (H) IL-6 excretion in urine. (I) Monocyte chemoattractant protein-1 excretion in urine. (J) Mesangial expansion expressed as percentage of glomerular area. (K) Masson trichrome staining for interstitial fibrosis and glomerulosclerosis. MMP, matrix metalloprotease. Scale bar=100 µM. (L) Quantification of profibrotic gene expression by real-time PCR. *P<0.01 versus other groups; #P<0.05 versus vehicle-treated Ins2Akita mice. (M) GFR was determined as described in the Concise Methods section. *P<0.05 versus other groups. n=12–16.
Figure 5.
Figure 5.
IL-17A administration treats established nephropathy in a genetic model of type 2 diabetes. (A) IL-17A treatment protocol for db/db mice. IP, intraperitoneally. (B) db/db mice show obese phenotype as seen by increased body weight, which was not altered with IL-17A treatment. (C) Blood glucose level at 20 weeks of age. (D) Kidney weight-to-body weight (KW/BW) ratio. (E) Albumin excretion rate (AER). Albumin excretion was expressed as μg/24-hour urine. (F) Glomerular area. (G) TNF-α excretion in urine. (H) IL-6 excretion. (I) Monocyte chemoattractant protein-1 (MCP-1) excretion. (J) Plasma triglyceride levels. (K) Plasma LDL/VLDL cholesterol levels. (L) Plasma HDL cholesterol level. (M) Plasma total cholesterol level. (N) Quantification of profibrotic gene (α-smooth muscle actin (αSMA), collagen IV, and fibronectin) expression by real-time PCR. (O) PAS-stained kidney section showing glomerular expansion and mesangial expansion. Scale bar=100 µM. *P<0.001 versus other groups; #P<0.05 versus vehicle treated db/db mice. n=10 in each group.
Figure 6.
Figure 6.
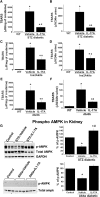
IL-17A suppresses oxidative stress and restored diabetes-induced downregulation of phospho AMPK levels. Oxidative stress was assessed by TBARS excretion in urine. Diabetes induced a large increase in TBARS excretion in urine, which was suppressed with IL-17A treatment in STZ (A and B), Ins2Akita (C and D), and db/db (E and F) mice. Urine samples are from the same animal in Figures 2, 4, and 5. *P<0.005 versus control; #P<0.05 versus vehicle-treated diabetic mice. n=10–15. Diabetes-induced downregulation of AMPK phosphorylation in the kidney was restored to control levels with IL-17A treatment. *P<0.001 versus control; #P<0.001 versus vehicle-treated db/db mice. n=4–6.
Figure 7.
Figure 7.
IL-17 receptor A (IL-17RA), podocyte, and tubular injury marker expression in kidney and urine. (A) Immunohistochemical localization of IL-17RA and KIM-1 in control and diabetic kidney. IL-17RA expression is mostly seen in proximal tubular epithelial cells. Diabetes increased staining intensity, but the pattern is not changed. IL-17A administration did not alter IL-17A expression. KIM-1 expression is absent in control kidney and expression of KIM-1 is increased in diabetic mice kidney. IL-17A treatment suppressed KIM-1 expression in diabetic kidney. Scale bar=100 µM. (B) Western blot analysis of KIM-1 and sema3A excretion in urine. (C) Quantification of podocyte injury marker nephrin excretion in urine. STZ diabetic mice (12 weeks), Ins2Akita mice (30 weeks) and db/db mice (20 weeks) treated with vehicle or IL-17A and excretion of nephrin was quantified by ELISA as described in the Concise Methods. IL-17A administration significantly reduced the excretion of nephrin in urine. *P<0.001 versus other groups. #P<0.001 versus vehicle-treated diabetic mice. (D and E) Quantification of podocytes in glomerular section that are immunostained with Wilms tumor-1 antibody (D) and positive cells in 20 glomeruli in each kidney was counted then averaged (E). Scale bar=100 µM. *P<0.05 versus other group. n=4–6.
Figure 8.
Figure 8.
Regulation of AMWAP and IL-10 by IL-17A in different cells. (A) Administration of IL-17A induced a large increase in AMWAP expression in Ins2Akita kidney analyzed by real-time PCR. *P<0.001 versus WT control; #P<0.001 versus vehicle treated Ins2Akita mice. (B) RT-PCR analysis of AMWAP and IL-10 expression in mouse podocyte. *P<0.01 versus vehicle treated control. (C) RT-PCR analysis of AMWAP expression in TKPTS (mouse proximal tubular epithelial cells). *P<0.01 versus 0 hour. (D) AMPK inhibitor suppressed IL-17A–induced AMWAP expression in TKPTS cells. **P<0.001 versus other groups. (E) IL-17A administration enhanced IL-10 excretion in urine of Ins2Akita mice. *P<0.001 versus WT control; #P<0.001 versus vehicle-treated Ins2Akita mice. (F) IL-17A administration enhanced IL-10 excretion in diabetic mouse urine at 12 weeks after STZ administration. *P<0.01 versus vehicle treated nondiabetic control; #P<0.001 versus vehicle-treated diabetic control. IL-17A (50 ng/ml) (G) and IL-17F (50 ng/ml) (H) treatment induced AMWAP expression in macrophages within hours, whereas IL-10 expression takes 72 hours. *P<0.001 versus 0 hour. (I) Recombinant AMWAP treatment induced IL-10 and arginase-1 expression in macrophages. *P<0.001 versus vehicle-treated. (J) Recombinant AMWAP treatment induced IL-10 protein expression in macrophages. IL-10 protein in culture supernatant was quantified by ELISA. *P<0.01 versus vehicle-treated. (K) AMWAP suppressed LPS-induced IL-1β expression in macrophages. **P<0.001 versus other groups. (L) Recombinant AMWAP treatment induced IL-10 expression in mouse podocyte. *P<0.001 versus vehicle treated. n=6–10.
Figure 9.
Figure 9.
Recombinant AMWAP administration suppressed diabetic nephropathy in mice. Six-week-old DBA2/J mice were made diabetic with STZ. (A) Four weeks after confirmation of hyperglycemia, mice received vehicle or recombinant AMWAP for another 4 weeks (10 ng per animal per day). Administration of recombinant AMWAP suppressed diabetes-induced albuminuria (E and F), glomerulosclerosis (G), but not blood glucose level (B), kidney weight (C), or body weight (D). AER, albumin excretion rate. Scale bar=100 µM. *P<0.001 versus control; #P<0.01 versus vehicle-treated diabetic animals. (F) AMWAP suppressed M1 polarization markers, such as IL-6 (H) and IL-1β (I) but increased M2 marker arginase-1 (J), IL-10 (K) expression in kidney and excretion in urine (L and M). *P<0.001 versus control; #P<0.01 versus vehicle-treated diabetic animals. n=8–10.
Figure 10.
Figure 10.
Epithelial specific overexpression of IL-17A is sufficient to suppress diabetic nephropathy. Data from IL-17A transgenic mouse Line 1. (A) IL-17A transgenic mice were crossed with nephropathy prone strain DBA/2J. Six-week-old WT and IL-17A–positive F1 mice were given single dose of STZ (150 mg/kg body wt). Mice were euthanized 8 weeks after STZ administration, and albuminuria were quantified. (B) Blood glucose level at 8 weeks of diabetes. (C) Albumin excretion rate (AER) expressed as μg/24-hour urine. (D) AER expressed as μg/mg creatinine. (E) Kidney hypertrophy was calculated as ratio of kidney weight and body weight (KW/BW). (F) Serum IL-17A levels. (G) Urine IL-17A levels. (H) Glomerular area. (I) Mesangial index. (J–M) PAS-hematoxylin–stained kidney section. Scale bar=100 µM. (J) WT control. (K) IL-17A transgenic control. (L) WT diabetic mice kidney. (M) IL-17A transgenic diabetic mice kidney. (N) AMWAP mRNA expression in the kidney. (O) Mannose receptor mRNA in the kidney. (P) IL-10 mRNA expression in the kidney. (Q) Quantification of TBARS for oxidative stress. *P<0.0001 versus other groups; #P<0.01 versus WT diabetic. n=7–9.
Figure 11.
Figure 11.
Epithelial cell–specific overexpression of IL-17A is sufficient to suppress diabetic nephropathy. Data from IL-17A transgenic Line 2. (A) IL-17A transgenic mice were crossed with nephropathy prone strain DBA/2J. Six-week-old WT and IL-17A–positive F1 mice were given a single dose of STZ (150 mg/kg body wt). Mice were euthanized 8 weeks after STZ administration and albuminuria was quantified. (B) Blood glucose level at 8 weeks of diabetes. (C) Kidney hypertrophy was calculated as ratio of kidney weight and body weight (KW/BW). (D) Albumin excretion rate (AER) expressed as μg/24-hour urine. (E) AER expressed as μg/mg of creatinine. (F) Serum IL-17A levels. (G) Urine IL-17A levels. (H) Mesangial index. (I) Glomerular area. (J–M) PAS-hematoxylin–stained kidney section. Scale bar=100 µM. (J) WT control. (K) IL-17A transgenic control. (K) WT diabetic mouse kidney. (L) IL-17A transgenic diabetic mouse kidney. (N–Q) Electron microscope images. Original magnification, ×15,000. WT control (N) and IL-17A transgenic control (O) kidney show normal podocyte foot process and basement membrane. Diabetes-induced podocyte foot process effacement (red arrowhead) and basement membrane thickening (red arrow) in WT (P), which was suppressed in IL-17A transgenic animals (Q and R) AMWAP mRNA expression in the kidney. (S) Mannose receptor mRNA in the kidney. (T) IL-10 mRNA expression in the kidney. (U) Quantification of TBARS for oxidative stress. *P<0.001 versus other groups; #P<0.001 versus WT diabetic. n=10–12.

Comment in

References

    1. Hostetter TH: Prevention of end-stage renal disease due to type 2 diabetes. N Engl J Med 345: 910–912, 2001 - PubMed
    1. Rossing P, de Zeeuw D: Need for better diabetes treatment for improved renal outcome. Kidney Int Suppl S28–S32, 2011 - PubMed
    1. Rosolowsky ET, Skupien J, Smiles AM, Niewczas M, Roshan B, Stanton R, Eckfeldt JH, Warram JH, Krolewski AS: Risk for ESRD in type 1 diabetes remains high despite renoprotection. J Am Soc Nephrol 22: 545–553, 2011 - PMC - PubMed
    1. Poplawski MM, Mastaitis JW, Isoda F, Grosjean F, Zheng F, Mobbs CV: Reversal of diabetic nephropathy by a ketogenic diet. PLoS ONE 6: e18604, 2011 - PMC - PubMed
    1. Baker RG, Hayden MS, Ghosh S: NF-κB, inflammation, and metabolic disease. [Abstract] Cell Metab 13: 11–22, 2011 - PMC - PubMed

Publication types

MeSH terms