The ZEB1/miR-200c feedback loop regulates invasion via actin interacting proteins MYLK and TKS5
- PMID: 26334100
- PMCID: PMC4694975
- DOI: 10.18632/oncotarget.4807
The ZEB1/miR-200c feedback loop regulates invasion via actin interacting proteins MYLK and TKS5
Abstract
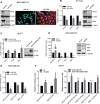
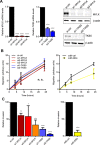
Epithelial to mesenchymal transition (EMT) is a developmental process which is aberrantly activated during cancer invasion and metastasis. Elevated expression of EMT-inducers like ZEB1 enables tumor cells to detach from the primary tumor and invade into the surrounding tissue. The main antagonist of ZEB1 in controlling EMT is the microRNA-200 family that is reciprocally linked to ZEB1 in a double negative feedback loop. Here, we further elucidate how the ZEB1/miR-200 feedback loop controls invasion of tumor cells. The process of EMT is attended by major changes in the actin cytoskeleton. Via in silico screening of genes encoding for actin interacting proteins, we identified two novel targets of miR-200c - TKS5 and MYLK (MLCK). Co-expression of both genes with ZEB1 was observed in several cancer cell lines as well as in breast cancer patients and correlated with low miR-200c levels. Depletion of TKS5 or MYLK in breast cancer cells reduced their invasive potential and their ability to form invadopodia. Whereas TKS5 is known to be a major component, we could identify MYLK as a novel player in invadopodia formation. In summary, TKS5 and MYLK represent two mediators of invasive behavior of cancer cells that are regulated by the ZEB1/miR-200 feedback loop.
Keywords: MYLK (MLCK); ZEB1; epithelial to mesenchymal transition (EMT); invadopodia; miR-200.
Figures


Similar articles
-
MiR-200c suppresses TGF-β signaling and counteracts trastuzumab resistance and metastasis by targeting ZNF217 and ZEB1 in breast cancer.Int J Cancer. 2014 Sep 15;135(6):1356-68. doi: 10.1002/ijc.28782. Epub 2014 Mar 3. Int J Cancer. 2014. PMID: 24615544
-
MiR-200 can repress breast cancer metastasis through ZEB1-independent but moesin-dependent pathways.Oncogene. 2014 Jul 31;33(31):4077-88. doi: 10.1038/onc.2013.370. Epub 2013 Sep 16. Oncogene. 2014. PMID: 24037528
-
Coordinated regulation of β-tubulin isotypes and epithelial-to-mesenchymal transition protein ZEB1 in breast cancer cells.Biochemistry. 2013 Aug 13;52(32):5482-90. doi: 10.1021/bi400340g. Epub 2013 Jul 29. Biochemistry. 2013. PMID: 23869586
-
ZEB/miR-200 feedback loop: at the crossroads of signal transduction in cancer.Int J Cancer. 2013 Feb 15;132(4):745-54. doi: 10.1002/ijc.27708. Epub 2012 Jul 21. Int J Cancer. 2013. PMID: 22753312 Review.
-
miR-200c: a versatile watchdog in cancer progression, EMT, and drug resistance.J Mol Med (Berl). 2016 Jun;94(6):629-44. doi: 10.1007/s00109-016-1420-5. Epub 2016 Apr 20. J Mol Med (Berl). 2016. PMID: 27094812 Review.
Cited by
-
PRG2 and AQPEP are misexpressed in fetal membranes in placenta previa and percreta†.Biol Reprod. 2021 Jul 2;105(1):244-257. doi: 10.1093/biolre/ioab068. Biol Reprod. 2021. PMID: 33982062 Free PMC article.
-
The Construction of ceRNA Regulatory Network Unraveled Prognostic Biomarkers and Repositioned Drug Candidates for the Management of Pancreatic Ductal Adenocarcinoma.Curr Issues Mol Biol. 2025 Jun 27;47(7):496. doi: 10.3390/cimb47070496. Curr Issues Mol Biol. 2025. PMID: 40728965 Free PMC article.
-
The clinicopathologic significance of Tks5 expression of peritoneal mesothelial cells in gastric cancer patients.PLoS One. 2021 Jul 13;16(7):e0253702. doi: 10.1371/journal.pone.0253702. eCollection 2021. PLoS One. 2021. PMID: 34255789 Free PMC article.
-
Differential Effects of Snail-KO in Human Breast Epithelial Cells and Human Breast Epithelial × Human Breast Cancer Hybrids.Int J Mol Sci. 2025 Jul 22;26(15):7033. doi: 10.3390/ijms26157033. Int J Mol Sci. 2025. PMID: 40806166 Free PMC article.
-
miR-205-5p Downregulation and ZEB1 Upregulation Characterize the Disseminated Tumor Cells in Patients with Invasive Ductal Breast Cancer.Int J Mol Sci. 2021 Dec 22;23(1):103. doi: 10.3390/ijms23010103. Int J Mol Sci. 2021. PMID: 35008529 Free PMC article.
References
-
- Thiery JP, Acloque H, Huang RY, Nieto MA. Epithelial-mesenchymal transitions in development and disease. Cell. 2009;139:871–890. - PubMed
-
- Hurteau GJ, Carlson JA, Spivack SD, Brock GJ. Overexpression of the microRNA hsa-miR-200c leads to reduced expression of transcription factor 8 and increased expression of E-cadherin. Cancer research. 2007;67:7972–7976. - PubMed
-
- Gregory PA, Bert AG, Paterson EL, Barry SC, Tsykin A, Farshid G, Vadas MA, Khew-Goodall Y, Goodall GJ. The miR-200 family and miR-205 regulate epithelial to mesenchymal transition by targeting ZEB1 and SIP1. Nature cell biology. 2008;10:593–601. - PubMed
Publication types
MeSH terms
Substances
LinkOut - more resources
Full Text Sources
Other Literature Sources
Medical
Molecular Biology Databases
Miscellaneous

