. 2015 Sep 3;10(9):e0136760.
doi: 10.1371/journal.pone.0136760. eCollection 2015.

Regulation of hedgehog Ligand Expression by the N-End Rule Ubiquitin-Protein Ligase Hyperplastic Discs and the Drosophila GSK3β Homologue, Shaggy

Affiliations

Regulation of hedgehog Ligand Expression by the N-End Rule Ubiquitin-Protein Ligase Hyperplastic Discs and the Drosophila GSK3β Homologue, Shaggy

Sophie Moncrieff et al. PLoS One. .

Abstract

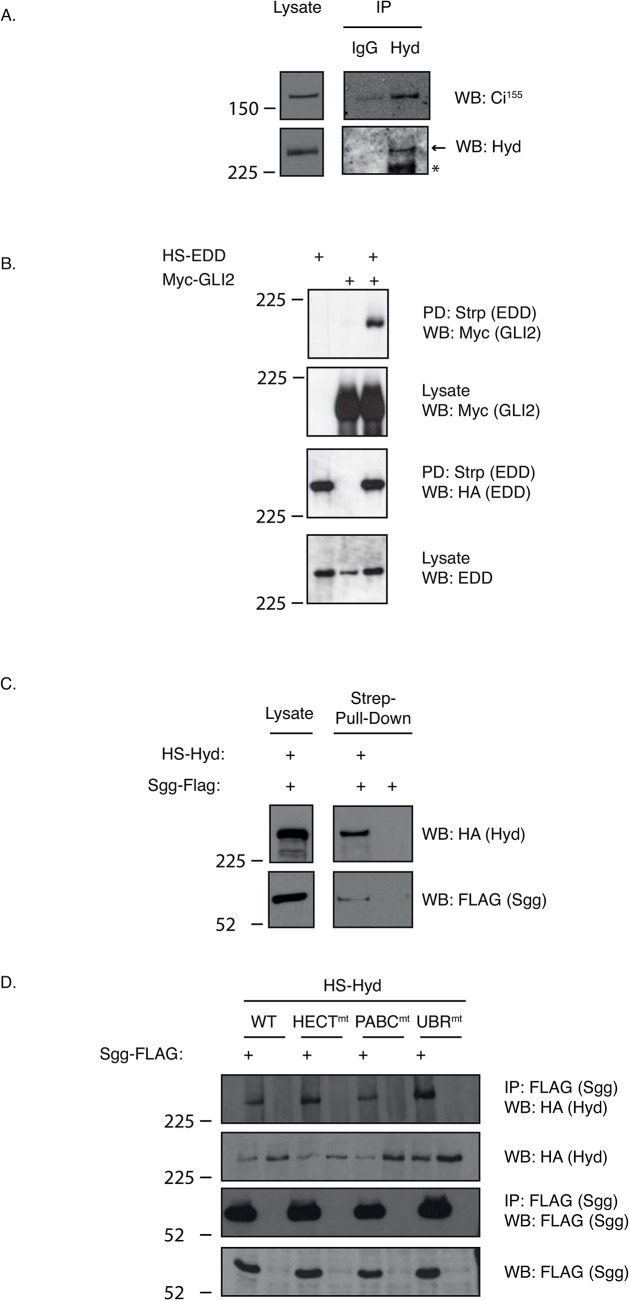
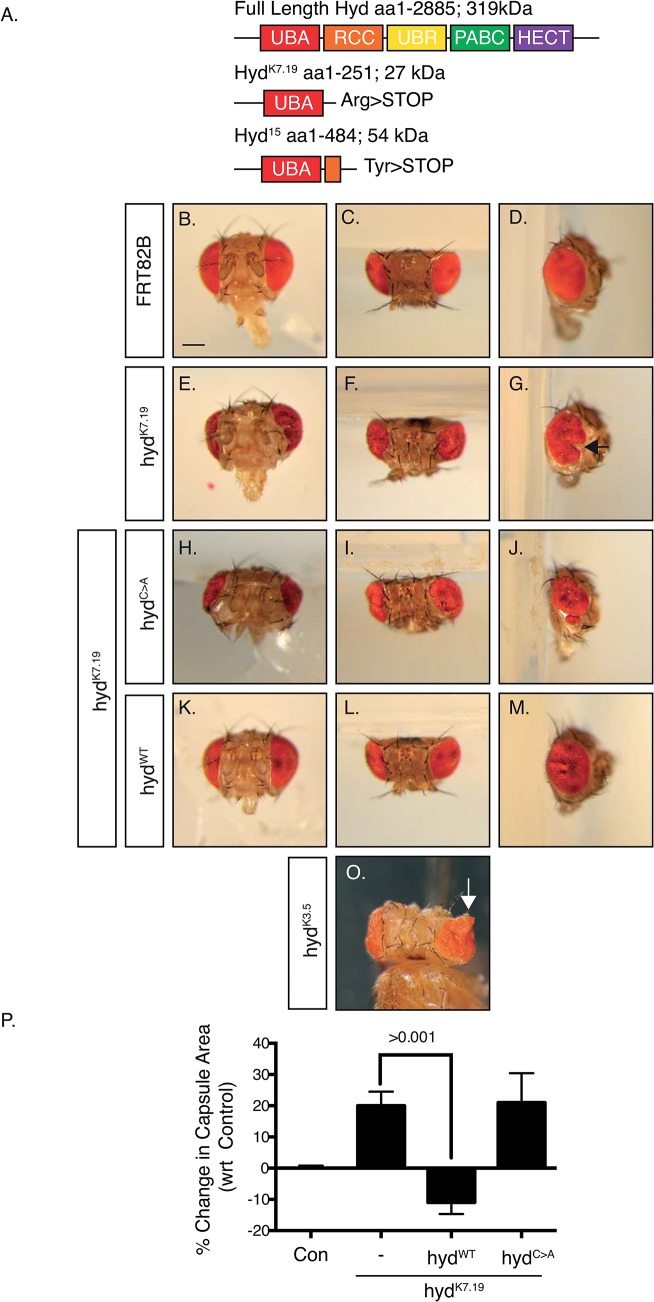
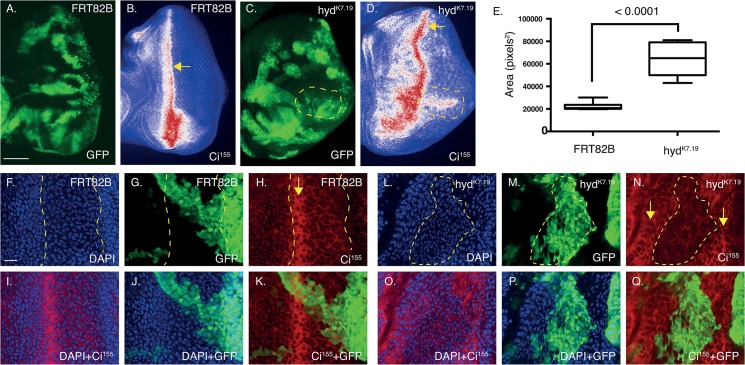
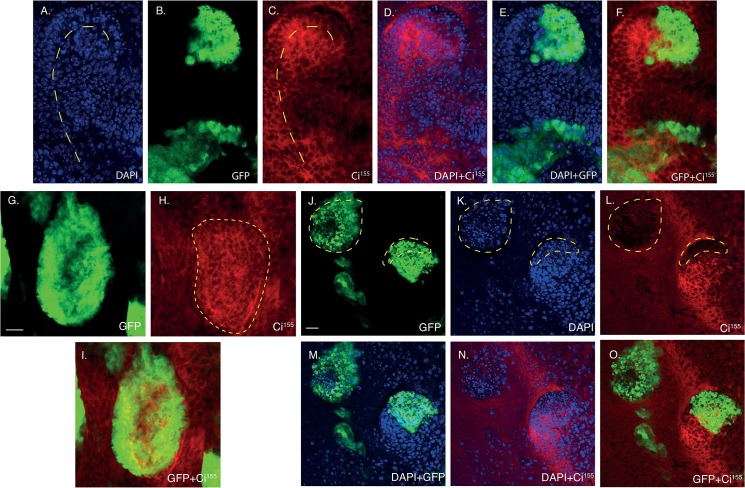
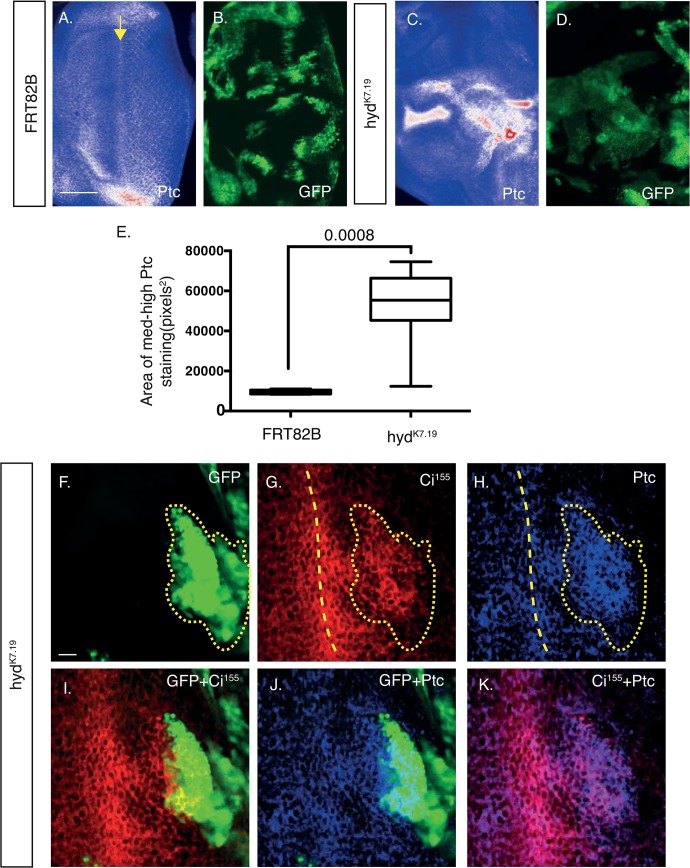
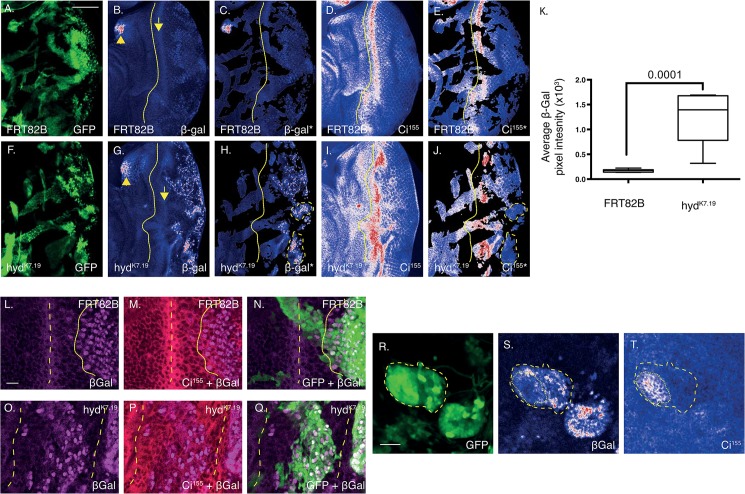
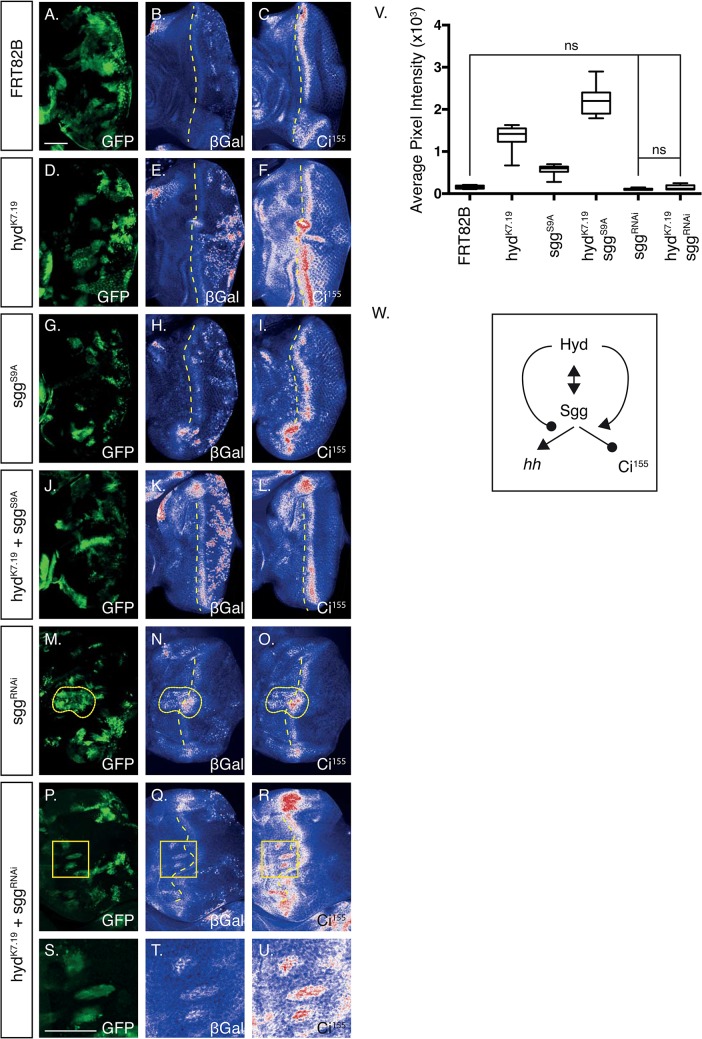
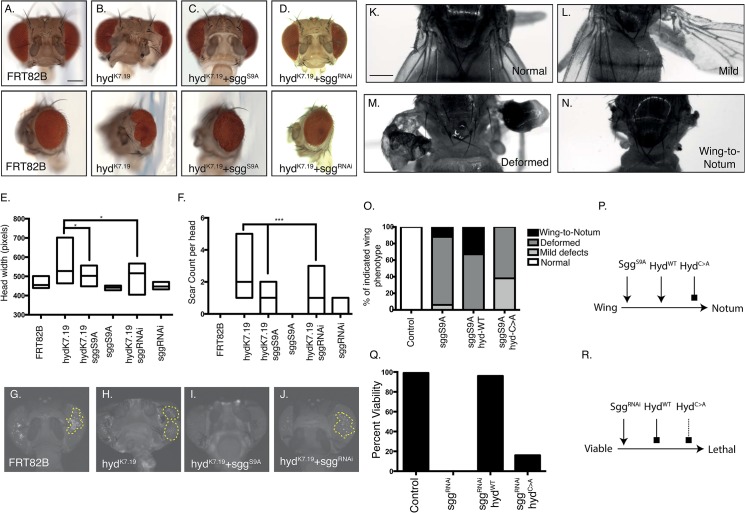
Hedgehog (Hh) morphogen signalling plays an essential role in tissue development and homeostasis. While much is known about the Hh signal transduction pathway, far less is known about the molecules that regulate the expression of the hedgehog (hh) ligand itself. Here we reveal that Shaggy (Sgg), the Drosophila melanogaster orthologue of GSK3β, and the N-end Rule Ubiquitin-protein ligase Hyperplastic Discs (Hyd) act together to co-ordinate Hedgehog signalling through regulating hh ligand expression and Cubitus interruptus (Ci) expression. Increased hh and Ci expression within hyd mutant clones was effectively suppressed by sgg RNAi, placing sgg downstream of hyd. Functionally, sgg RNAi also rescued the adult hyd mutant head phenotype. Consistent with the genetic interactions, we found Hyd to physically interact with Sgg and Ci. Taken together we propose that Hyd and Sgg function to co-ordinate hh ligand and Ci expression, which in turn influences important developmental signalling pathways during imaginal disc development. These findings are important as tight temporal/spatial regulation of hh ligand expression underlies its important roles in animal development and tissue homeostasis. When deregulated, hh ligand family misexpression underlies numerous human diseases (e.g., colorectal, lung, pancreatic and haematological cancers) and developmental defects (e.g., cyclopia and polydactyly). In summary, our Drosophila-based findings highlight an apical role for Hyd and Sgg in initiating Hedgehog signalling, which could also be evolutionarily conserved in mammals.


Conflict of interest statement

Competing Interests: The authors have declared that no competing interests exist.

Figures

Fig 1
Fig 1. Hyd binds the Hedgehog pathway’s key transcriptional effector Ci155 and the Ci-regulatory kinase Sgg.
Co-immunoprecipitation (A,D) and affinity-purification (B,C) studies with the indicated affinity reagents were examined by SDS-PAGE and Western blotting with the indicated antibodies. (A) Drosophila CL8 cells were lysed and incubated with either Hyd or control IgG antibodies and affinity purified by Protein G beads. An arrow indicates the position of the expected size band and an asterisk indicates the presence of an uncharacterised faster migrating Hyd species. (B) Mammalian HEK293 cells were transfected with the indicated constructs and lysates underwent Streptactin-mediated purification (Strp) to purify Haemagglutinin-Streptactin-EDD (HS-EDD) and detect co-purified Myc-GLI2. (C) Drosophila S2 cells were transfected with either HS-hyd or HS-vector control, lysed and then incubated with Streptactin-affinity resin. Control and Hyd-coated beads were then incubated with Sgg-FLAG expressing S2 lysate and, following washing, analysed for bound Sgg-FLAG. Only the HS-Hyd beads purified FLAG-Sgg. (D) Drosophila S2 cells were co-transfected with the indicated hyd mutant and sgg-FLAG constructs and FLAG-affinity purified complexes were analysed with the indicated antibodies.
Fig 2
Fig 2. hyd K7.19 is defective in HECT E3 function and causes abnormal head development.
(A) Schematic representation of the full length Hyd protein containing the Ubiquitin Association Domain (UBA), Regulator of Chromatin Condensation-like (RCC), Ubiquitin-Protein Ligase E3 Component N-Recognin (UBR) domain, Poly(A)-Binding Protein C-Terminal (PABC) and Homologous to the E6AP Carboxyl Terminus (HECT) domains and the potential protein products encoded by hyd k7.19 and hyd 15. In comparison to control heads (B-D), hyd k7.19 flies (E-G) exhibited disruption of the adult eye and increased head-capsule area. Co-expression of the hyd WT (K-M), but not hyd C>A (H-J), transgene suppressed the hyd k7.19 phenotype. Scale bar = 200μm. (O) hyd K3.5 flies exhibit eye tissue outgrowths that are not present in hyd k7.19 heads. (P) Quantification of the head capsule area of the indicated genotype. % values are normalised to control. n = >10 of each genotype. s.e.m and indicated p value determined by Student’s t-test.
Fig 3
Fig 3. hyd K7.19 EA discs exhibit aberrant Ci155 expression patterns and morphogenetic furrow-associated features.
(A-D) Deconvolved widefield and confocal image (F-Q) sections of control FRT82B (A,B, F-K)) and hyd k7.19 (C,D, L-Q) EA discs imaged for direct GFP fluorescence (A,C,G,K), Ci155 immunofluorescence (B,D,H,I,K) and DAPI (A,B,C,E,F,G). (A-D) hyd k7.19 EA discs exhibit abnormal Ci155 expression patterns. A “Union Jack” lookup table was applied to Ci155 images to visualise low (blue), medium (white) and high (red) intensity levels and arrows marks the presumed Ci155 DVS / morphogenetic furrow and an asterisk indicates increased Ci155 staining as a result of the tissue folding over in itself (B). (D) hyd k7.19 EA discs exhibited ectopic Ci155 expression in the posterior compartment (E, marked by a dashed yellow line, which is also overlaid onto C). (E) Quantification of the area of medium-to-high Ci155 signal in control and hyd k7.19 EA discs. n = 5, s.e.m and indicated p value determined by Student’s t-test. (F-Q) hyd k7.19 EA discs exhibit abnormal markers of the morphogenetic furrow. Control FRT82B EA discs exhibited normal nuclei distribution (F) and DVS Ci155 expression (H), while hyd k7.19 discs exhibited irregular patterns (L,N). (F-H) Dashed lines indicated the DVS’s associated high anterior and low posterior Ci155 expression margins (H), which is overlaid onto (F,G). (L-N) A region of low Ci155 expression flanked by two DVS-like regions of high Ci155 expression is marked by a dashed outline (N), which is overlaid onto (L,M). Arrows mark high Ci155 DVS (H), or DVS-like (N), signals. Scales bars (A-D) 50μm and (F-Q) 10μm.
Fig 4
Fig 4. hyd k7.19 clones exhibit distinct patterns of Ci155 expression.
Confocal image sections of hyd k7.19 EA discs imaged for direct GFP fluorescence (B,E,F,G,I,J,M,O) Ci155 immunofluorescence (C,D,F,H,I,L,N,O) and DAPI (A,D,E,K,M,N). (A-F) hyd k7.19 discs exhibited curved arrays of nuclei (A, dashed line) that were reflected in the Ci155 DVS (C, dashed line). (G-I) Posterior hyd k7.19 clones near the DVS exhibited increased Ci155 expression (H, dashed outline). (J-O) Anterior hyd k7.19 clones near the DVS exhibited decreased Ci155 expression (L, low Ci155 marked by dashed lines, which are overlaid onto J,K). Scale bars = 10μm.
Fig 5
Fig 5. hyd k7.19 EA discs exhibit abnormal Ptc expression.
(A-D) Deconvolved widefield and (F-K) confocal image sections of control FRT82B (A,B) and hyd k7.19 (C,D and F-K) EA discs imaged for GFP fluorescence and the indicated antigens for IF. “Union Jack” lookup table applied to Ptc images (A,C) to visualise low (blue), medium (white) and high (red) intensity levels. (E) Quantification of the area of medium and high Ptc signal. n = 3, s.e.m and indicated p value determined by Student’s t-test. (F-K) Overlapping expression of Ci155 and Ptc immunofluorescence within a hyd k7.19 GFP-positive clone anterior to the Ci155 DVS (F yellow dotted outline, which is overlaid onto G,H). The yellow dashed line indicates the Ci155 DVS, which is overlaid onto H). Scale bars = 50μm (A-D) and 10μm (F-K).
Fig 6
Fig 6. hyd k7.19 EA discs exhibit increased hh-lacZ-associated β-Gal expression within the posterior compartment and DVS-region.
Confocal image sections of FRT82B control (A-E, L-N)) and hyd k7.19 (F-J, O-T) EA discs imaged for direct GFP fluorescence (A,F,N,Q,R), β-Gal (B,C,G,H,L-Q,S) and Ci155 immunofluorescence (D,E,I,J,M,P,T). (A-K) hyd k7.19 EA discs exhibited increased β-Gal expression (H) relative to FRT82B controls (C). Non-clonal regions (GFP—ve regions) were ‘masked off’ to help visualise β-Gal and Ci155 expression only within GFP-positive clones (C,H and E,J, respectively). Yellow dotted lines indicate the division between anterior and posterior compartment (B—E and G-J). Dashed yellow lines indicate regions of high hh expression (H) and corresponding low Ci155 expression (E). (K) Quantification of the β-Gal average pixel intensity of the masked off images. n = 5, s.e.m and indicated p value determined by Student’s t-test. Scale bars = 50μm. (L-Q) hyd k7.19 DVS regions exhibited abnormal β-Gal (O) and Ci155 (P) expression. Dashed lines indicate high Ci155 DVS expression (M,P), which are overlaid onto the other panels. The dotted line marks the anterior front of high β-Gal expression (L), which is overlaid on (M,N). (R-T) Two GFP positive hyd k7.19 clones (R), located in the posterior compartment clearly overexpressed β-Gal (S). Of those clones, only one (R yellow dashed line, which is overlaid onto S,T) also harboured increased Ci155 expression (T). A specific clonal subregion (T, dotted line) with the clone coincided with low β-Gal expression (S, dotted line). Scale bars = 10μm.
Fig 7
Fig 7. Sgg regulates hh-lacZ expression in both the posterior and anterior compartments.
(A-U) Confocal images of EA disc of the indicated genotypes imaged for GFP (A,D,G,J,M,P,S) fluorescence and β-Gal (B,E,H,K,N,Q,T) and Ci155 (C,F,I,L,O,R,U) immunofluorescence. Dashed lines indicate the division between the anterior and posterior compartments, dotted lines indicate regions of high β-Gal and Ci155 expression within and anterior to the DVS region (N,O, respectively). The boxed regions (P-R) indicate a region harbouring three clones overexpressing β-Gal and Ci155 in the anterior compartment, which are enlarged in (S-U). (V) Boxplots of quantification of the average β-Gal pixel intensity of non-GFP masked off images (not shown). n = >5 for each genotype, s.e.m indicated. Statistical analysis by one-way ANOVA and Tukey’s multiple comparison tests, which revealed all comparisons to be statistically significant, except those indicated as non-significant (ns). (W) Potential model to explain the effects observed in the posterior EA disc. The double-headed arrow indicates a physical interaction, the single-headed arrow a positive regulatory action and the round-headed arrow a negative regulatory action. Scale bar = 50μm.
Fig 8
Fig 8. Sgg and Hyd genetically interact to govern animal viability and head and wing development.
(A-J) Sgg perturbation modifies the hyd k7.19 head phenotype. (A-D) Brightfield images of adult Drosophila heads of the indicated genotypes shown either ‘head on’ (upper panels) or ‘side on’ (lower panels). Both gain (C) and loss (D) of sgg function appeared to rescue the hyd k7.19 phenotype. Boxplots indicating head width (E, n = ≥8 for each genotype) and counts of eye scars (F, n = ≥8 for each genotype) of the indicated genotypes, with statistical analysis by one-way ANOVA (E) and Fishers exact test (F) revealed statistical significance (asterisks). (G-J) Representative GFP fluorescent signals in adult Drosophila heads of the indicated genotypes revealed only hyd k7.19 +sgg S9A animals lack a GFP signal (n = ≥4 for each genotype). Scale bars = 175μm. (K-P) hyd WT overexpression promotes the sgg S9A-mediated wing phenotype. (K-N) Brightfield images of adult Drosophila wings showing (K) normal, (L) mildly deformed, (M) severely deformed and (N) wing-to-notum phenotypes. (O) Percentage of adult wing phenotypes of vg-GAL4 flies expressing the indicated transgenes, revealing that the hyd WT transgene enhanced, and the hyd C>A transgene suppressed the severity of the sgg S9A wing defects (n ≥12 for each genotype). (P) Model showing the genetic interaction between sgg S9A and hyd UAS-transgenes with respect to the wing-to-notum phenotype. Arrows indicate promotion and blockhead arrows inhibition. (Q-R) hyd WT overexpression rescues sgg RNAi-mediated embryonic lethality. Percentage viability of sca-GAL4 flies expressing the indicated transgenes revealed a >95% rescue of embryonic lethality upon co-expression with the UAS-hyd WT, but not UAS-hyd C>A, transgene (16 individual crosses per genotype). (R) Model showing the genetic interaction between sgg and hyd UAS-transgenes. Arrows indicate promotion, blockhead arrows inhibition and dotted blockhead arrow weak inhibition. Scale bar = 250μm.

References

    1. Pan Y, Bai CB, Joyner AL, Wang B. Sonic hedgehog signaling regulates Gli2 transcriptional activity by suppressing its processing and degradation. Molecular and cellular biology. 2006;26(9):3365–77. Epub 2006/04/14. 10.1128/MCB.26.9.3365-3377.2006 - DOI - PMC - PubMed
    1. Briscoe J, Therond PP. The mechanisms of Hedgehog signalling and its roles in development and disease. Nature reviews Molecular cell biology. 2013;14(7):416–29. Epub 2013/05/31. 10.1038/nrm3598 . - DOI - PubMed
    1. Baker NE. Patterning signals and proliferation in Drosophila imaginal discs. Current opinion in genetics & development. 2007;17(4):287–93. Epub 2007/07/13. 10.1016/j.gde.2007.05.005 . - DOI - PubMed
    1. Sutherland C. What Are the bona fide GSK3 Substrates? Int J Alzheimers Dis. 2011;2011:505607 Epub 2011/06/02. 10.4061/2011/505607 - DOI - PMC - PubMed
    1. Price MA, Kalderon D. Proteolysis of the Hedgehog signaling effector Cubitus interruptus requires phosphorylation by Glycogen Synthase Kinase 3 and Casein Kinase 1. Cell. 2002;108(6):823–35. Epub 2002/04/17. . - PubMed

Publication types

LinkOut - more resources