

Genomic consequences of selection and genome-wide association mapping in soybean
- PMID: 26334313
- PMCID: PMC4559069
- DOI: 10.1186/s12864-015-1872-y
Genomic consequences of selection and genome-wide association mapping in soybean
Abstract
Background: Crop improvement always involves selection of specific alleles at genes controlling traits of agronomic importance, likely resulting in detectable signatures of selection within the genome of modern soybean (Glycine max L. Merr.). The identification of these signatures of selection is meaningful from the perspective of evolutionary biology and for uncovering the genetic architecture of agronomic traits.
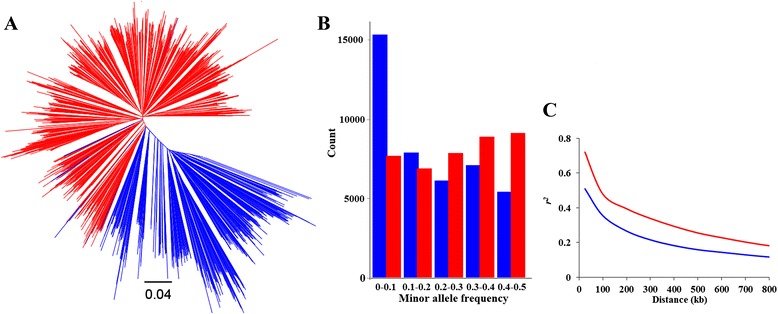
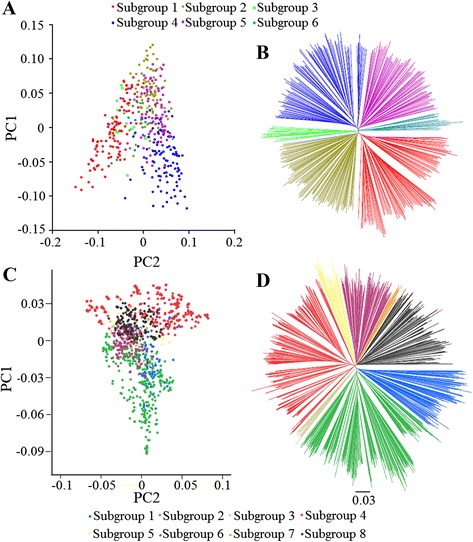
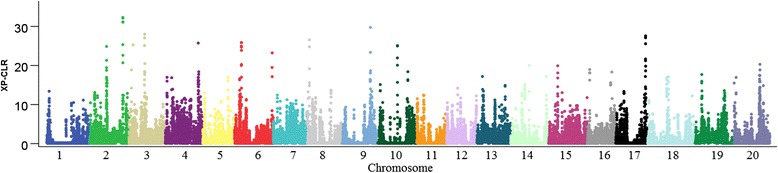
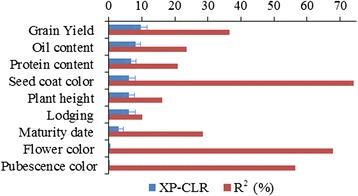
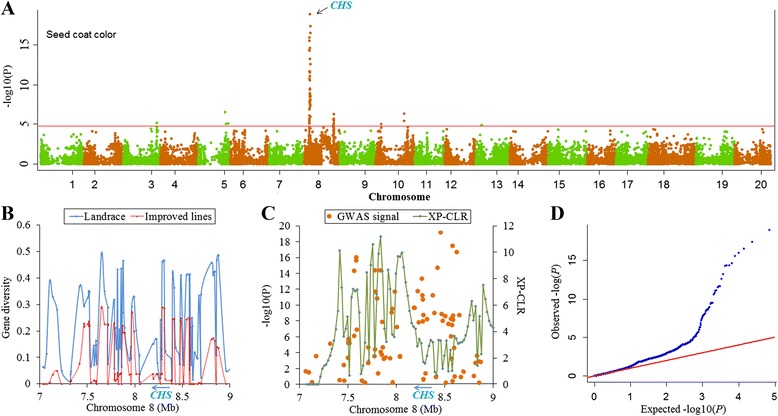
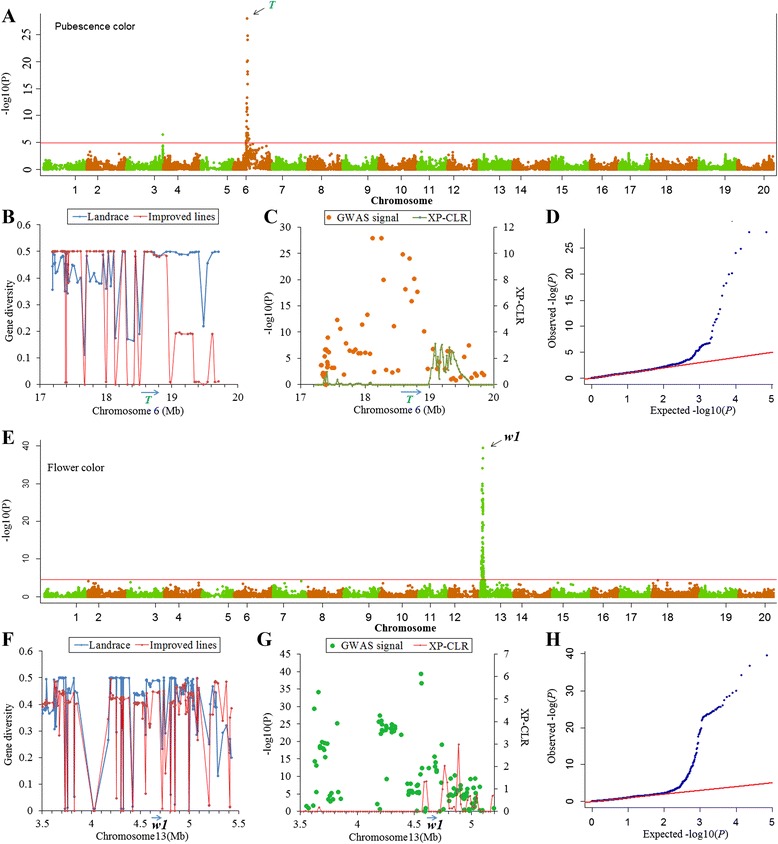
Results: To this end, two populations of soybean, consisting of 342 landraces and 1062 improved lines, were genotyped with the SoySNP50K Illumina BeadChip containing 52,041 single nucleotide polymorphisms (SNPs), and systematically phenotyped for 9 agronomic traits. A cross-population composite likelihood ratio (XP-CLR) method was used to screen the signals of selective sweeps. A total of 125 candidate selection regions were identified, many of which harbored genes potentially involved in crop improvement. To further investigate whether these candidate regions were in fact enriched for genes affected by selection, genome-wide association studies (GWAS) were conducted on 7 selection traits targeted in soybean breeding (grain yield, plant height, lodging, maturity date, seed coat color, seed protein and oil content) and 2 non-selection traits (pubescence and flower color). Major genomic regions associated with selection traits overlapped with candidate selection regions, whereas no overlap of this kind occurred for the non-selection traits, suggesting that the selection sweeps identified are associated with traits of agronomic importance. Multiple novel loci and refined map locations of known loci related to these traits were also identified.
Conclusions: These findings illustrate that comparative genomic analyses, especially when combined with GWAS, are a promising approach to dissect the genetic architecture of complex traits.
Figures
Similar articles
-
Identification of novel loci associated with maturity and yield traits in early maturity soybean plant introduction lines.BMC Genomics. 2018 Mar 1;19(1):167. doi: 10.1186/s12864-018-4558-4. BMC Genomics. 2018. PMID: 29490606 Free PMC article.
-
Genome-wide association study for flowering time, maturity dates and plant height in early maturing soybean (Glycine max) germplasm.BMC Genomics. 2015 Mar 20;16(1):217. doi: 10.1186/s12864-015-1441-4. BMC Genomics. 2015. PMID: 25887991 Free PMC article.
-
Identification of loci governing eight agronomic traits using a GBS-GWAS approach and validation by QTL mapping in soya bean.Plant Biotechnol J. 2015 Feb;13(2):211-21. doi: 10.1111/pbi.12249. Epub 2014 Sep 12. Plant Biotechnol J. 2015. PMID: 25213593
-
Characterization of Disease Resistance Loci in the USDA Soybean Germplasm Collection Using Genome-Wide Association Studies.Phytopathology. 2016 Oct;106(10):1139-1151. doi: 10.1094/PHYTO-01-16-0042-FI. Epub 2016 Jul 11. Phytopathology. 2016. PMID: 27135674 Review.
-
Understanding and utilizing crop genome diversity via high-resolution genotyping.Plant Biotechnol J. 2016 Apr;14(4):1086-94. doi: 10.1111/pbi.12456. Epub 2015 Aug 19. Plant Biotechnol J. 2016. PMID: 27003869 Free PMC article. Review.
Cited by
-
Genome-Wide Association Study and Selection Signatures Detect Genomic Regions Associated with Seed Yield and Oil Quality in Flax.Int J Mol Sci. 2018 Aug 6;19(8):2303. doi: 10.3390/ijms19082303. Int J Mol Sci. 2018. PMID: 30082613 Free PMC article.
-
Population Structure and Genetic Diversity of the 175 Soybean Breeding Lines and Varieties Cultivated in West Siberia and Other Regions of Russia.Plants (Basel). 2023 Oct 6;12(19):3490. doi: 10.3390/plants12193490. Plants (Basel). 2023. PMID: 37836230 Free PMC article.
-
A Genome-Wide Genetic Diversity Scan Reveals Multiple Signatures of Selection in a European Soybean Collection Compared to Chinese Collections of Wild and Cultivated Soybean Accessions.Front Plant Sci. 2021 Feb 26;12:631767. doi: 10.3389/fpls.2021.631767. eCollection 2021. Front Plant Sci. 2021. PMID: 33732276 Free PMC article.
-
Genomic Signatures of North American Soybean Improvement Inform Diversity Enrichment Strategies and Clarify the Impact of Hybridization.G3 (Bethesda). 2016 Sep 8;6(9):2693-705. doi: 10.1534/g3.116.029215. G3 (Bethesda). 2016. PMID: 27402364 Free PMC article.
-
Genotyping of Soybean Cultivars With Medium-Density Array Reveals the Population Structure and QTNs Underlying Maturity and Seed Traits.Front Plant Sci. 2018 May 9;9:610. doi: 10.3389/fpls.2018.00610. eCollection 2018. Front Plant Sci. 2018. PMID: 29868067 Free PMC article.
References
-
- Xiong D, Zhao T, Gai J. Parental analysis of soybean cultivars released in China. Scientia Agricultura Sinica. 2008;41(9):2589–98.
-
- Gizlice Z, Carter TE, Burton JW. Genetic base for North American public soybean cultivars released between 1947 and 1988. Crop Sci. 1994;34:1143–51. doi: 10.2135/cropsci1994.0011183X003400050001x. - DOI
Publication types
MeSH terms
LinkOut - more resources
Full Text Sources
Other Literature Sources
