

Chemical exchange saturation transfer (CEST) MR technique for in-vivo liver imaging at 3.0 tesla
- PMID: 26334509
- PMCID: PMC5746030
- DOI: 10.1007/s00330-015-3972-0
Chemical exchange saturation transfer (CEST) MR technique for in-vivo liver imaging at 3.0 tesla
Abstract
Purpose: To evaluate Chemical Exchange Saturation Transfer (CEST) MRI for liver imaging at 3.0-T.
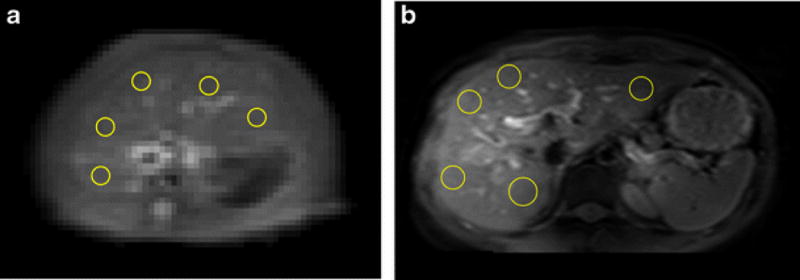
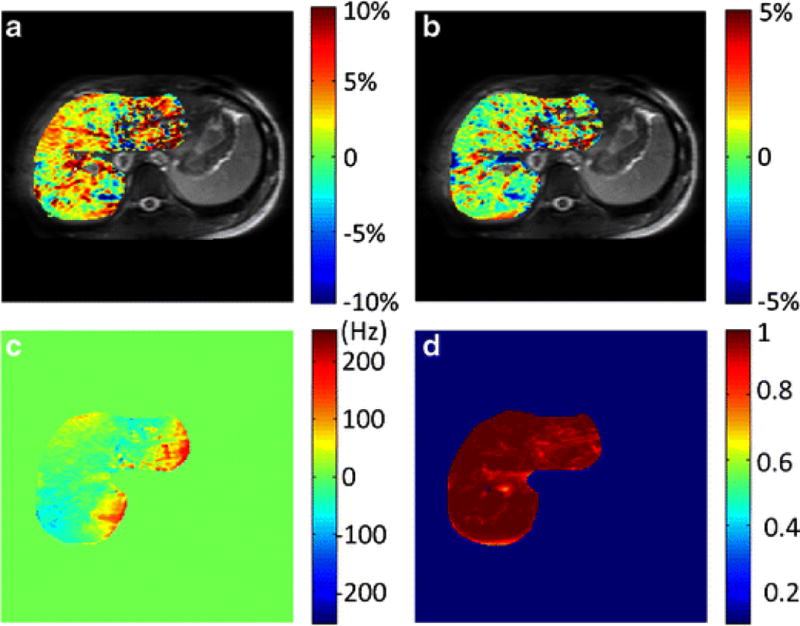
Materials and methods: Images were acquired at offsets (n = 41, increment = 0.25 ppm) from -5 to 5 ppm using a TSE sequence with a continuous rectangular saturation pulse. Amide proton transfer-weighted (APTw) and GlycoCEST signals were quantified as the asymmetric magnetization transfer ratio (MTRasym) at 3.5 ppm and the total MTRasym integrated from 0.5 to 1.5 ppm, respectively, from the corrected Z-spectrum. Reproducibility was assessed for rats and humans. Eight rats were devoid of chow for 24 hours and scanned before and after fasting. Eleven rats were scanned before and after one-time CCl4 intoxication.
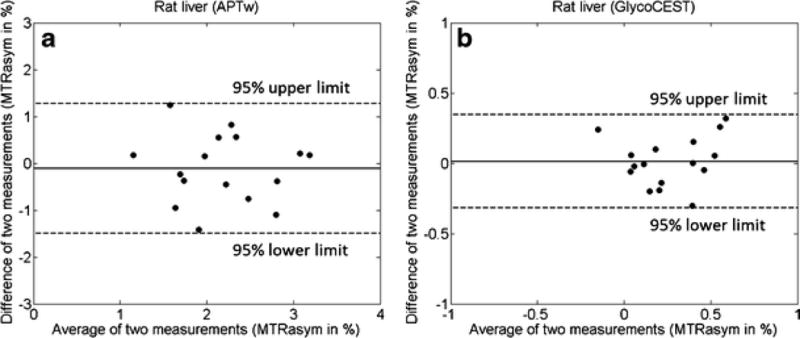
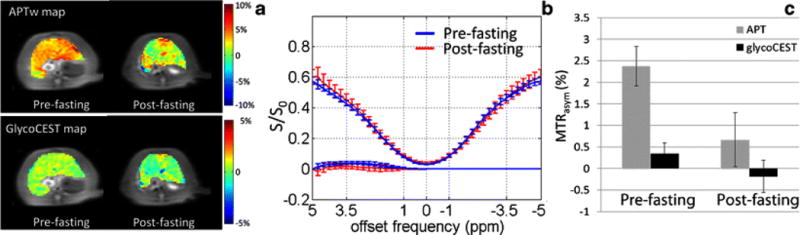
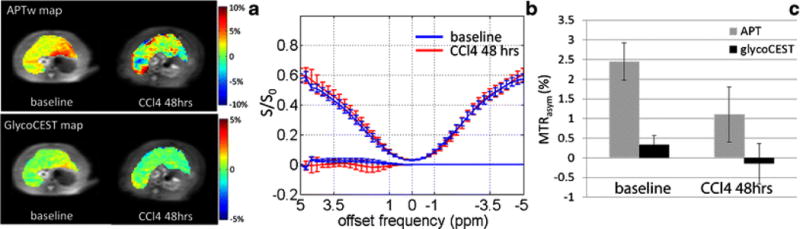
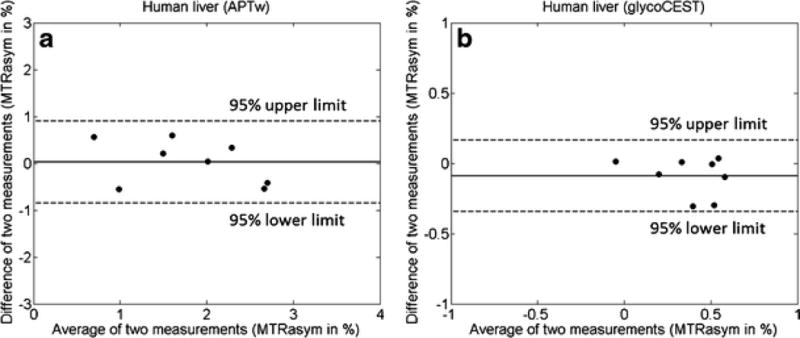
Results: For reproducibility, rat liver APTw and GlycoCEST measurements had 95 % limits of agreement of -1.49 % to 1.28 % and -0.317 % to 0.345 %. Human liver APTw and GlycoCEST measurements had 95 % limits of agreement of -0.842 % to 0.899 % and -0.344 % to 0.164 %. After 24 hours, fasting rat liver APTw and GlycoCEST signals decreased from 2.38 ± 0.86 % to 0.67 ± 1.12 % and from 0.34 ± 0.26 % to -0.18 ± 0.37 % respectively (p < 0.05). After CCl4 intoxication rat liver APTw and GlycoCEST signals decreased from 2.46 ± 0.48 % to 1.10 ± 0.77 %, and from 0.34 ± 0.23 % to -0.16 ± 0.51 % respectively (p < 0.05).
Conclusion: CEST liver imaging at 3.0-T showed high sensitivity for fasting as well as CCl4 intoxication.
Key points: • CEST MRI of in-vivo liver was demonstrated at clinical 3 T field strength. • After 24-hour fasting, rat liver APTw and GlycoCEST signals decreased significantly. • After CCl4 intoxication both rat liver APTw and GlycoCEST signals decreased significantly. • Good scan-rescan reproducibility of liver CEST MRI was shown in healthy volunteers.
Keywords: Amide proton transfer (APT); Chemical exchange saturation transfer (CEST); Glycogen; Liver; Magnetic resonance imaging.
Conflict of interest statement
The scientific guarantor of this publication is Dr Yi-Xiang Wang. Dr Juan Wei is an employee of Philips Healthcare. The other authors declare no conflict of interest.
Figures
References
-
- Wallace K, Burt AD, Wright MC. Liver fibrosis. Biochem J. 2008;411:1–18. - PubMed
-
- Patel K, Shackel NA. Current status of fibrosis markers. Curr Opin Gastroenterol. 2008;30:253–9. - PubMed
-
- Tatsumi C, Kudo M, Ueshima K, Kitai S, Takahashi S, Inoue T, Minami Y, Chung H, Maekawa K, Fujimoto K, Akiko T, Takeshi M. Noninvasive evaluation of hepatic fibrosis using serum fibrotic markers, transient elastography (FibroScan) and real-time tissue elastography. Intervirology. 2008;51(Suppl 1):27–33. - PubMed
-
- Sy S, Huang S, Wang YX, Yu J, Ahuja AT, Zhang YT, Pickwell-MacPherson E. Terahertz spectroscopy of liver cirrhosis: investigating the origin of contrast. Phys Med Biol. 2010;55:7587–96. - PubMed
Publication types
MeSH terms
Substances
Grants and funding
LinkOut - more resources
Full Text Sources
Other Literature Sources
Medical
