. 2016 Feb;278(2):524-35.
doi: 10.1148/radiol.2015150486. Epub 2015 Sep 2.

Is the Relationship between Cortical and White Matter Pathologic Changes in Multiple Sclerosis Spatially Specific? A Multimodal 7-T and 3-T MR Imaging Study with Surface and Tract-based Analysis

Affiliations

Is the Relationship between Cortical and White Matter Pathologic Changes in Multiple Sclerosis Spatially Specific? A Multimodal 7-T and 3-T MR Imaging Study with Surface and Tract-based Analysis

Céline Louapre et al. Radiology. 2016 Feb.

Abstract

Purpose: To investigate in vivo the spatial specificity of the interdependence between intracortical and white matter (WM) pathologic changes as function of cortical depth and distance from the cortex in multiple sclerosis (MS), and their independent contribution to physical and cognitive disability.

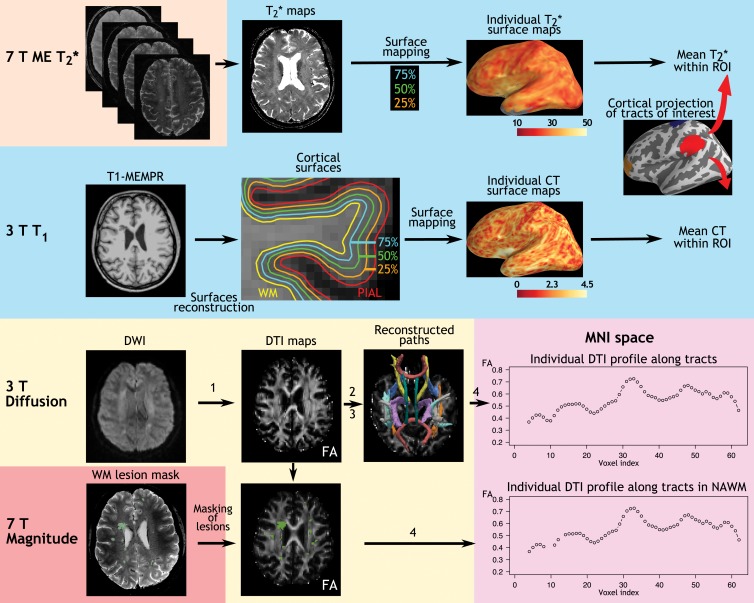
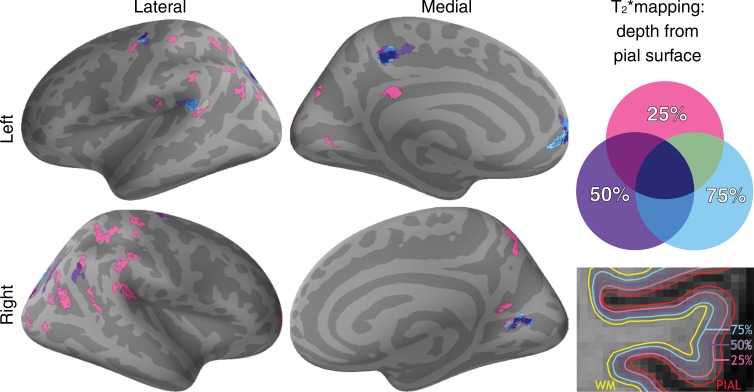
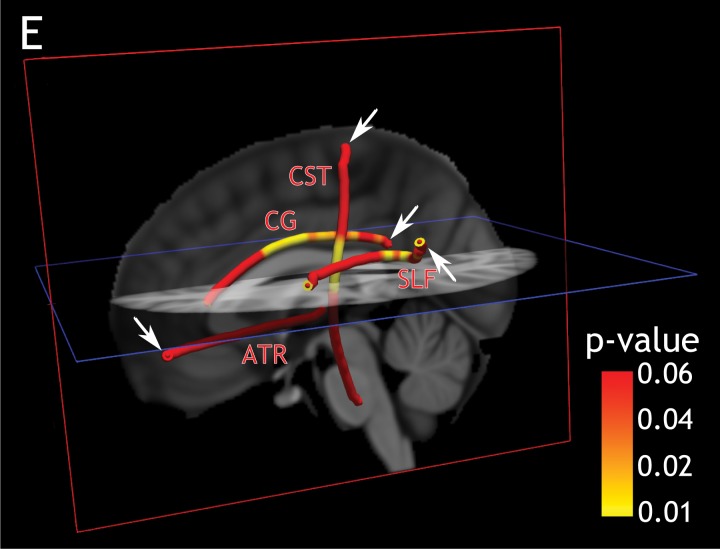
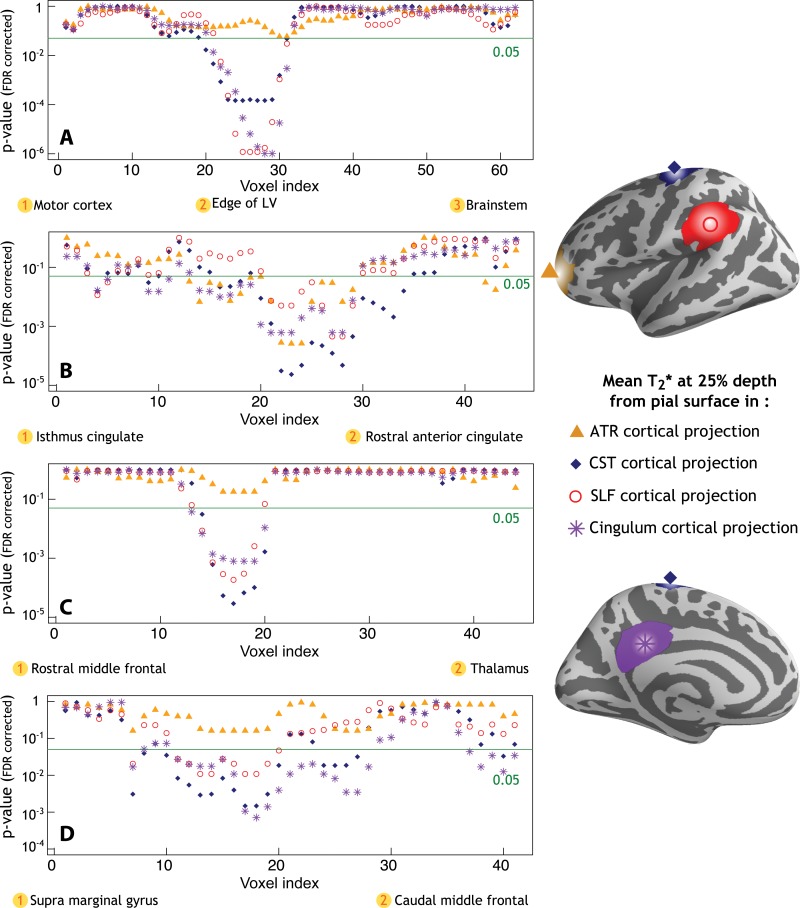
Materials and methods: This study was institutional review board-approved and participants gave written informed consent. In 34 MS patients and 17 age-matched control participants, 7-T quantitative T2* maps, 3-T T1-weighted anatomic images for cortical surface reconstruction, and 3-T diffusion tensor images (DTI) were obtained. Cortical quantitative T2* maps were sampled at 25%, 50%, 75% depth from pial surface. Tracts of interest were reconstructed by using probabilistic tractography. The relationship between DTI metrics voxelwise of the tracts and cortical integrity in the projection cortex was tested by using multilinear regression models.

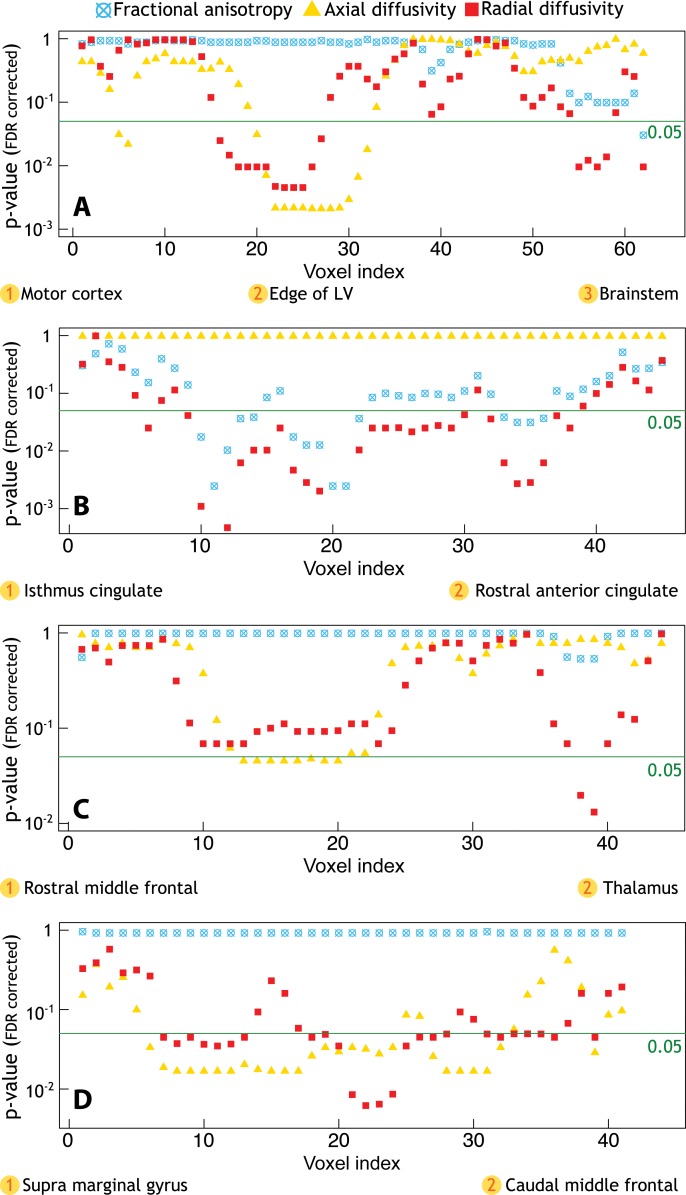
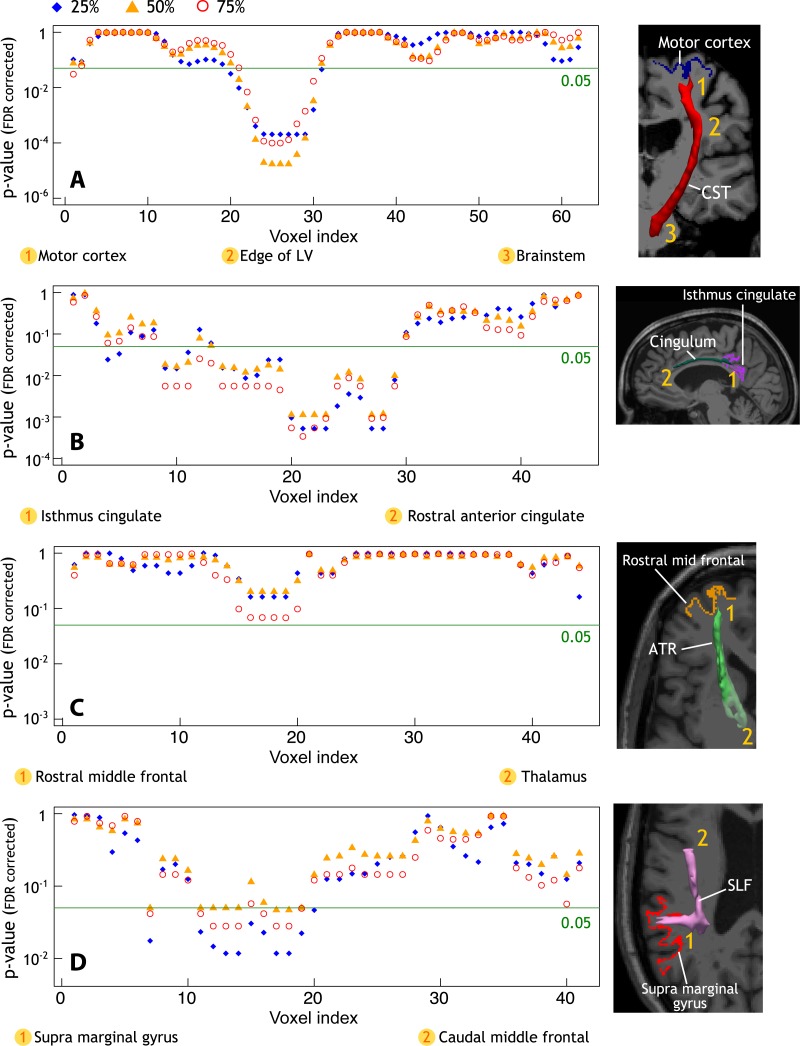
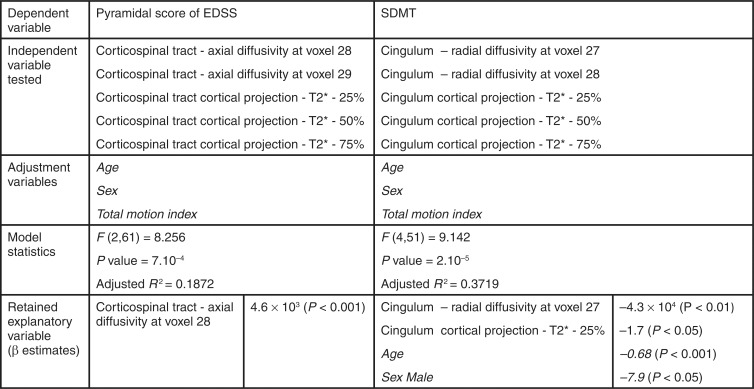
Results: In MS, DTI abnormal findings along tracts correlated with quantitative T2* changes (suggestive of iron and myelin loss) at each depth of the cortical projection area (P < .01, corrected). This association, however, was not spatially specific because abnormal findings in WM tracts also related to cortical pathologic changes outside of the projection cortex of the tract (P < .001). Expanded Disability Status Scale pyramidal score was predicted by axial diffusivity along the corticospinal tract (β = 4.6 × 10(3); P < .001), Symbol Digit Modalities Test score by radial diffusivity along the cingulum (β = -4.3 × 10(4); P < .01), and T2* in the cingulum cortical projection at 25% depth (β = -1.7; P < .05).

Conclusion: Intracortical and WM injury are concomitant pathologic processes in MS, which are not uniquely distributed according to a tract-cortex-specific pattern; their association may reflect a common stage-dependent mechanism.


Figures

Figure 1:
Figure 1:
Imaging analysis pipeline. The 7-T quantitative multiecho (ME) T2* cortical maps were obtained voxel-wise by using Levenberg-Marquardt nonlinear regression analysis. Anatomic 3-T magnetization-prepared rapid acquisition with multiple gradient echo (MEMPR) images were processed by using FreeSurfer to reconstruct cortical surfaces and compute cortical thickness. Quantitative T2* maps were registered to the cortical surfaces, and sampled at 25%, 50%, and 75% depths from the pial surface. Diffusion weighted images (DWIs) were processed through the four steps of Tracts Constrained by Underlying Anatomy pipeline in FreeSurfer to, 1, generate DTI metrics, including fractional anisotropy (FA), radial diffusivity, and axial diffusivity maps; 2, run probabilistic tractography; 3, generate fractional anisotropy, radial diffusivity, and axial diffusivity profiles along WM paths in a patient’s native space; and, 4, to realign paths on the Montreal Neurologic Institute (MNI) template and generate fractional anisotropy, radial diffusivity, axial diffusivity profiles for group statistics. CT = cortical thickness, NAWM = normal-appearing WM, ROI = region of interest.
Figure 2:
Figure 2:
Overlay of the general linear model significance maps (P < .05, corrected for multiple comparisons) shows clusters of increased cortical T2* in 34 patients with MS relative to 17 healthy control participants at 25%, 50%, and 75% depth from the pial surface. Age and sex were included as adjustment variables.
Figure 3:
Figure 3:
Profiles of P values along WM tracts of interest obtained from linear regression models that tested differences in fractional anisotropy, radial diffusivity, and axial diffusivity between 34 patients with MS and 17 healthy control participants. Age, sex, and total movement index were included as adjustment variables. A, There was a significant increase in axial diffusivity and radial diffusivity along the corticospinal tract, mainly located in the portion of the tract close to the edge of the lateral ventricles (LV), and in the distal portion within the brainstem. B, Additionally, MS patients exhibited relative to controls a diffuse increase in radial diffusivity and decrease in fractional anisotropy along the entire cingulum, C, a significant increase in axial diffusivity and radial diffusivity along the anterior thalamic radiation, mainly in the proximal portion and in the portion closest to the thalamus, and, D, a diffuse increase in axial diffusivity and radial diffusivity along the entire superior longitudinal fasciculus. FDR = false discovery rate.
Figure 4:
Figure 4:
A–D, Profiles of P values along WM tracts of interest. Age, sex, and total movement index were included as adjustment variables in all analyses. Graphs showing profile of P values in 34 patients with MS and WM tracts of interest obtained from linear regression models show a positive correlation between cortical T2* in the, A, motor cortex and axial diffusivity along the corticospinal tract (CST), B, isthmus cingulate cortex and radial diffusivity along the cingulum, C, rostral middle frontal cortex and radial diffusivity along the anterior thalamic radiation (ATR), and D, supra marginal gyrus and radial diffusivity along the superior longitudinal fasciculus (SLF). FDR = false discovery rate, LV = lateral ventricle. E, Three-dimensional view of the brain and the corresponding P values along WM tracts as reported in parts A, B, C, and D (T2* at 25% depth from pial surface, arrows indicate the endpoint of tracts corresponding to cortical region of interest).
Figure 4:
Figure 4:
A–D, Profiles of P values along WM tracts of interest. Age, sex, and total movement index were included as adjustment variables in all analyses. Graphs showing profile of P values in 34 patients with MS and WM tracts of interest obtained from linear regression models show a positive correlation between cortical T2* in the, A, motor cortex and axial diffusivity along the corticospinal tract (CST), B, isthmus cingulate cortex and radial diffusivity along the cingulum, C, rostral middle frontal cortex and radial diffusivity along the anterior thalamic radiation (ATR), and D, supra marginal gyrus and radial diffusivity along the superior longitudinal fasciculus (SLF). FDR = false discovery rate, LV = lateral ventricle. E, Three-dimensional view of the brain and the corresponding P values along WM tracts as reported in parts A, B, C, and D (T2* at 25% depth from pial surface, arrows indicate the endpoint of tracts corresponding to cortical region of interest).
Figure 5:
Figure 5:
Profiles of P values along tracts of interest obtained from linear regression models that show in 34 patients with MS a positive correlation between diffusion imaging metrics, including, A, axial diffusivity along the corticospinal tract (CST) and cortical T2*, B, radial diffusivity along the cingulum and cortical T2*, C, radial diffusivity along the anterior thalamic radiation (ATR) and cortical T2*, and D, radial diffusivity along the superior longitudinal fasciculus (SLF) and cortical T2*. LV = lateral ventricle.
Figure 6:
Figure 6:
Imaging predictors of pyramidal functional subscore of EDSS and SDMT with multiple linear regression analysis in patients with MS. Only imaging parameters that correlated with the clinical variable at univariate analysis were used as candidate independent variable in multiple stepwise linear regression model. The retained explanatory variables are displayed with β estimates. Adjustment variables retained in the model are listed in italics. Voxel location along the tracts refers to voxel index as presented in Figure 3, 4, and 5.

References

    1. Filippi M, Evangelou N, Kangarlu A, et al. . Ultra-high-field MR imaging in multiple sclerosis. J Neurol Neurosurg Psychiatry 2014;85(1):60–66. - PubMed
    1. Nielsen AS, Kinkel RP, Madigan N, Tinelli E, Benner T, Mainero C. Contribution of cortical lesion subtypes at 7T MRI to physical and cognitive performance in MS. Neurology 2013;81(7):641–649. - PMC - PubMed
    1. Calabrese M, Poretto V, Favaretto A, et al. . Cortical lesion load associates with progression of disability in multiple sclerosis. Brain 2012;135(Pt 10):2952–2961. - PubMed
    1. Kutzelnigg A, Lassmann H. Cortical demyelination in multiple sclerosis: a substrate for cognitive deficits? J Neurol Sci 2006;245(1-2):123–126. - PubMed
    1. Magliozzi R, Howell O, Vora A, et al. . Meningeal B-cell follicles in secondary progressive multiple sclerosis associate with early onset of disease and severe cortical pathology. Brain 2007;130(Pt 4):1089–1104. - PubMed

Publication types