TEL2 suppresses metastasis by down-regulating SERPINE1 in nasopharyngeal carcinoma
- PMID: 26335051
- PMCID: PMC4745723
- DOI: 10.18632/oncotarget.5074
TEL2 suppresses metastasis by down-regulating SERPINE1 in nasopharyngeal carcinoma
Abstract
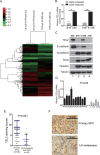
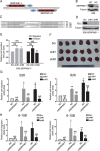
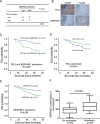
Metastasis is the major cause of treatment failure in patients with nasopharyngeal carcinoma (NPC). However, the molecular mechanisms of NPC metastasis are poorly understood. Here, using our customized gene microarray containing all of the known human transcription factors and the current markers for epithelial-mesenchymal transition, we report that TEL2 was down-regulated in highly metastatic NPC cells and the metastatic tissues in lymph node. Mechanistically, TEL2 inhibits the cell migration and invasion in vitro and metastasis in vivo by directly suppressing the SERPINE1 promoter in NPC. Consistently, an inverse correlation was observed between the protein levels of TEL2 and SERPINE1 using clinical NPC samples. Collectively, we have provided the first evidence that TEL2 plays a key role in NPC metastasis by directly down-regulating SERPINE1, and that this novel axis of TEL2 / SERPINE1 may be valuable to develop new strategies for treating NPC patients with metastasis.
Keywords: SERPINE1; TEL2; metastasis; nasopharyngeal carcinoma.
Conflict of interest statement
The authors declare no conflict of interest.
Figures


Similar articles
-
Snail promotes metastasis of nasopharyngeal carcinoma partly by down-regulating TEL2.Cancer Commun (Lond). 2018 Sep 25;38(1):58. doi: 10.1186/s40880-018-0328-6. Cancer Commun (Lond). 2018. PMID: 30253797 Free PMC article.
-
Metastasis-suppressing NID2, an epigenetically-silenced gene, in the pathogenesis of nasopharyngeal carcinoma and esophageal squamous cell carcinoma.Oncotarget. 2016 Nov 29;7(48):78859-78871. doi: 10.18632/oncotarget.12889. Oncotarget. 2016. PMID: 27793011 Free PMC article.
-
MiR-29c suppresses invasion and metastasis by targeting TIAM1 in nasopharyngeal carcinoma.Cancer Lett. 2013 Feb 28;329(2):181-8. doi: 10.1016/j.canlet.2012.10.032. Epub 2012 Nov 8. Cancer Lett. 2013. PMID: 23142282
-
Annexin A2-mediated cancer progression and therapeutic resistance in nasopharyngeal carcinoma.J Biomed Sci. 2018 Mar 29;25(1):30. doi: 10.1186/s12929-018-0430-8. J Biomed Sci. 2018. PMID: 29598816 Free PMC article. Review.
-
Occipital lymph node metastasis from nasopharyngeal carcinoma: a special case report and literature review.Chin J Cancer. 2016 Jan 4;35:1. doi: 10.1186/s40880-015-0074-y. Chin J Cancer. 2016. PMID: 26728009 Free PMC article. Review.
Cited by
-
Integrated analysis of genes associated with poor prognosis of patients with colorectal cancer liver metastasis.Oncotarget. 2017 Apr 11;8(15):25500-25512. doi: 10.18632/oncotarget.16064. Oncotarget. 2017. PMID: 28424419 Free PMC article.
-
ETV7-Mediated DNAJC15 Repression Leads to Doxorubicin Resistance in Breast Cancer Cells.Neoplasia. 2018 Aug;20(8):857-870. doi: 10.1016/j.neo.2018.06.008. Epub 2018 Jul 17. Neoplasia. 2018. PMID: 30025229 Free PMC article.
-
CBX8 Suppresses Tumor Metastasis via Repressing Snail in Esophageal Squamous Cell Carcinoma.Theranostics. 2017 Aug 15;7(14):3478-3488. doi: 10.7150/thno.20717. eCollection 2017. Theranostics. 2017. PMID: 28912889 Free PMC article.
-
NRP1 promotes cell migration and invasion and serves as a therapeutic target in nasopharyngeal carcinoma.Int J Clin Exp Pathol. 2018 May 1;11(5):2460-2469. eCollection 2018. Int J Clin Exp Pathol. 2018. PMID: 31938358 Free PMC article.
-
DNA Methylation of the t-PA Gene Differs Between Various Immune Cell Subtypes Isolated From Depressed Patients Receiving Electroconvulsive Therapy.Front Psychiatry. 2020 Jun 19;11:571. doi: 10.3389/fpsyt.2020.00571. eCollection 2020. Front Psychiatry. 2020. PMID: 32636772 Free PMC article.
References
-
- Ahmad A, Stefani S. Distant metastases of nasopharyngeal carcinoma: a study of 256 male patients. J Surg Oncol. 1986;33:194–197. - PubMed
-
- Bei JX, Li Y, Jia WH, Feng BJ, Zhou G, Chen LZ, Feng QS, Low HQ, Zhang H, He F, Tai ES, Kang T, Liu ET, Liu J, Zeng YX. A genome-wide association study of nasopharyngeal carcinoma identifies three new susceptibility loci. Nat Genet. 2010;42:599–603. - PubMed
-
- Geara FB, Sanguineti G, Tucker SL, Garden AS, Ang KK, Morrison WH, Peters LJ. Carcinoma of the nasopharynx treated by radiotherapy alone: determinants of distant metastasis and survival. Radiother Oncol. 1997;43:53–61. - PubMed
-
- Huang CJ, Leung SW, Lian SL, Wang CJ, Fang FM, Ho YH. Patterns of distant metastases in nasopharyngeal carcinoma. The Kaohsiung journal of medical sciences. 1996;12:229–234. - PubMed
Publication types
MeSH terms
Substances
LinkOut - more resources
Full Text Sources
Other Literature Sources
Miscellaneous

