

Defining the optimal systolic phase targets using absolute delay time for reconstructions in dual-source coronary CT angiography
- PMID: 26335369
- PMCID: PMC5943709
- DOI: 10.1007/s10554-015-0755-2
Defining the optimal systolic phase targets using absolute delay time for reconstructions in dual-source coronary CT angiography
Abstract
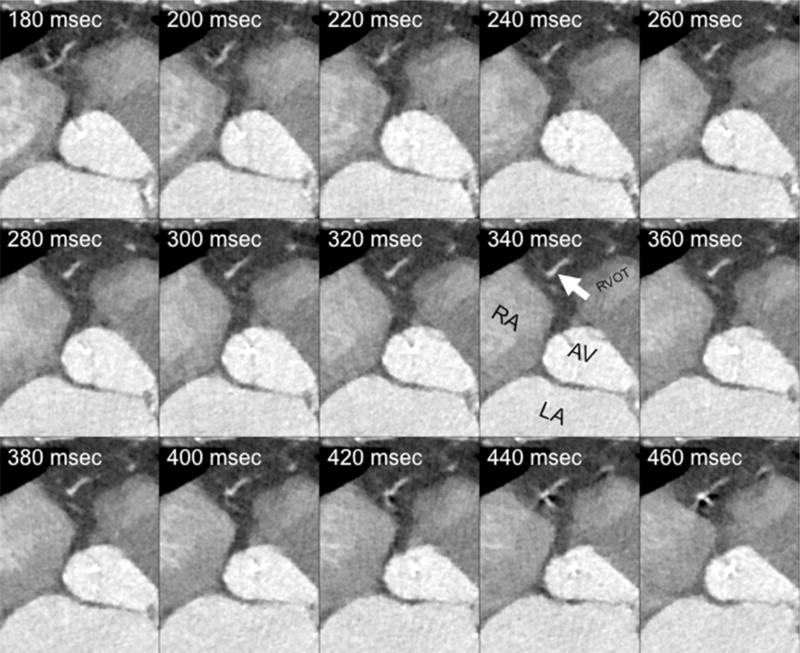
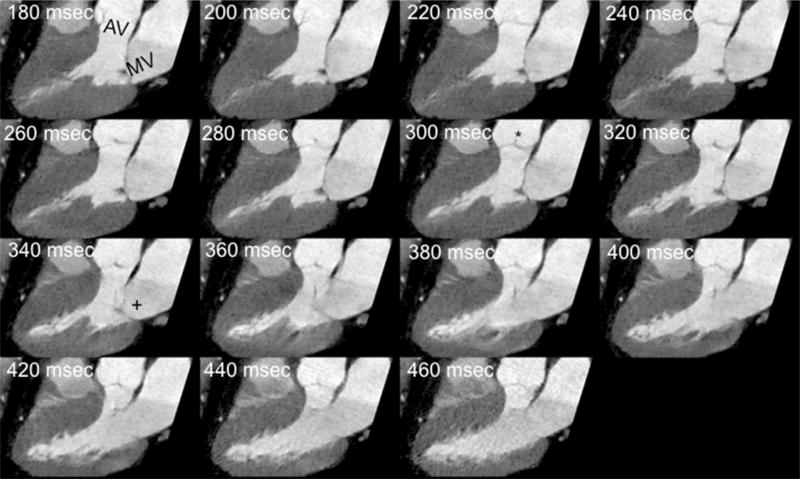
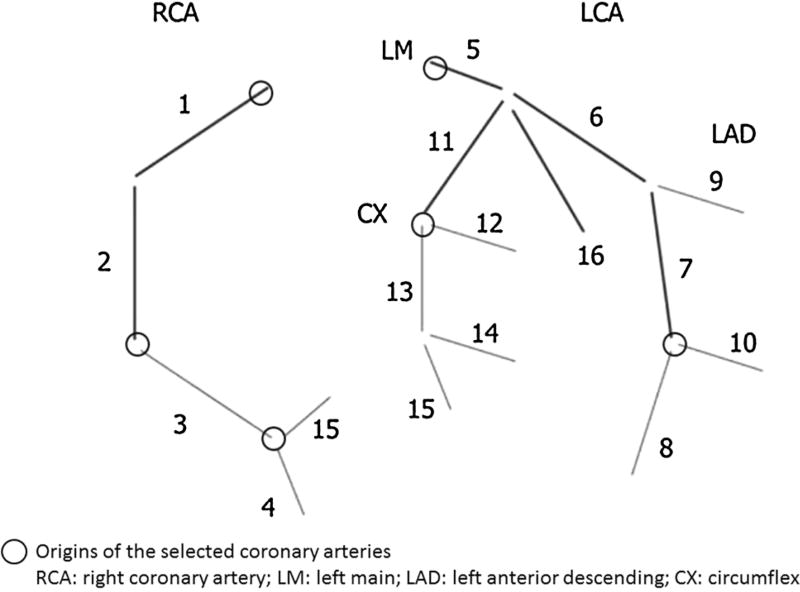
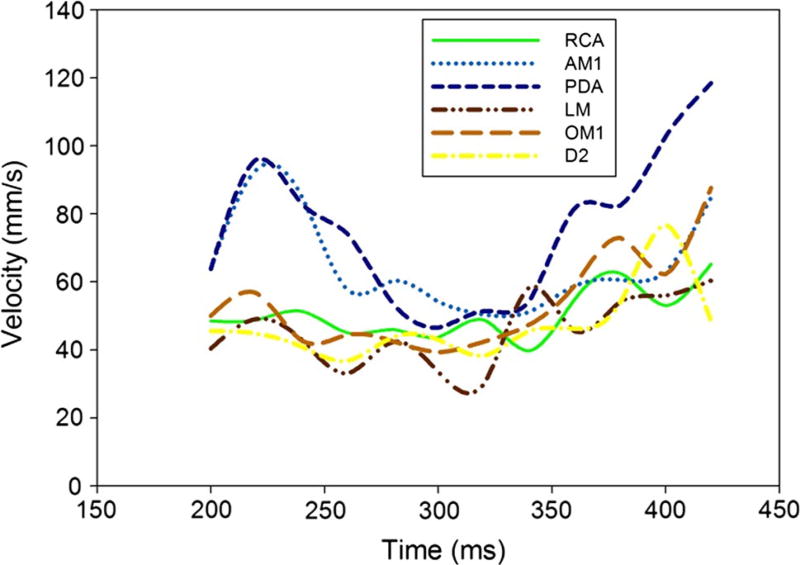
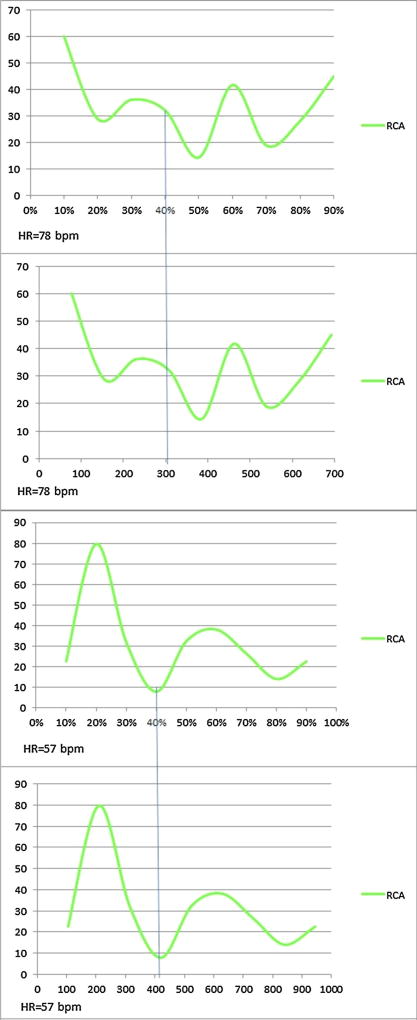
To define the optimal systolic phase for dual-source computed tomography angiography using an absolute reconstruction delay time after the R-R interval based on the coronary artery motion, we analyzed images reconstructed between 200 and 420 miliseconds (ms) after the R wave at 20 ms increments in 21 patients. Based on the American Heart Association coronary segmentation guidelines, the origin of six coronary artery landmarks (RCA, AM1, PDA, LM, OM1, and D2) were selected to calculate the coronary artery motion velocity. The velocity of the given landmark was defined as the quotient of the route and the length of the time interval. The x, y and z-coordinates of the selected landmark were recorded, and were used for the calculation of the 3D route of coronary artery motion by using a specific equation. Differences in velocities were assessed by analysis of variance for repeated measures; Bonferroni post hoc tests were used for multiple pair wise comparisons. 1488 landmarks were measured (6 locations at 12 systolic time points) in 21 patients and were analyzed. The mean values of the minimum velocities were calculated separately for each heart rate group (i.e. <65; 65-80; and >80 bpm). The mean lowest coronary artery velocities in each segment occurred in the middle period of each time interval of the acquired systolic phase i.e. 280-340 ms. No differences were found in the minimal coronary artery velocities between the three HR groups, with the exception of the AM1 branch (p = 0.00495) between <65 and >80 bpm (p = 0.03), and at HRs of 65-80 versus >80 bpm (p = 0.006). During an absolute delay of 200-420 ms after the R-wave, the ideal reconstruction interval varies significantly among coronary artery segments. Decreased velocities occur between 280 to 340 ms. Therefore a narrow range of systolic intervals, rather than a single phase, should be acquired.
Keywords: Absolute delay time; Coronary CT angiography; Dual-source CT; Systolic phase targets.
Conflict of interest statement
Figures
Similar articles
-
Optimal systolic and diastolic reconstruction windows for coronary CT angiography using dual-source CT.AJR Am J Roentgenol. 2007 Dec;189(6):1317-23. doi: 10.2214/AJR.07.2711. AJR Am J Roentgenol. 2007. PMID: 18029865
-
Relationship between heart rate and optimal reconstruction phase in coronary CT angiography performed on a 256-slice multidetector CT.Br J Radiol. 2019 Sep;92(1101):20180945. doi: 10.1259/bjr.20180945. Epub 2019 Jul 29. Br J Radiol. 2019. PMID: 31322906 Free PMC article.
-
Optimal systolic and diastolic reconstruction windows for coronary CT angiography using 320-detector rows dynamic volume CT.Clin Radiol. 2011 Jul;66(7):614-20. doi: 10.1016/j.crad.2011.02.007. Epub 2011 Apr 21. Clin Radiol. 2011. PMID: 21513921
-
Dual-source CT coronary angiography in patients with atrial fibrillation: comparison with single-source CT.Eur J Radiol. 2008 Dec;68(3):434-41. doi: 10.1016/j.ejrad.2008.09.011. Epub 2008 Nov 6. Eur J Radiol. 2008. PMID: 18993003
-
Reconstruction of coronary arteries from X-ray angiography: A review.Med Image Anal. 2016 Aug;32:46-68. doi: 10.1016/j.media.2016.02.007. Epub 2016 Mar 11. Med Image Anal. 2016. PMID: 27054277 Review.
Cited by
-
Distinguishing Type 1 from Type 2 Myocardial Infarction by Using CT Coronary Angiography.Radiol Cardiothorac Imaging. 2022 Oct 27;4(5):e220081. doi: 10.1148/ryct.220081. eCollection 2022 Oct. Radiol Cardiothorac Imaging. 2022. PMID: 36339063 Free PMC article.
-
Plaque Burden and 1-Year Outcomes in Acute Chest Pain: Results From the Multicenter RAPID-CTCA Trial.JACC Cardiovasc Imaging. 2022 Nov;15(11):1916-1925. doi: 10.1016/j.jcmg.2022.04.024. Epub 2022 Jun 15. JACC Cardiovasc Imaging. 2022. PMID: 36357133 Free PMC article.
-
Coronary CT angiography in the emergency department utilizing second and third generation dual source CT.J Cardiovasc Comput Tomogr. 2017 Jul-Aug;11(4):249-257. doi: 10.1016/j.jcct.2017.03.002. Epub 2017 Mar 22. J Cardiovasc Comput Tomogr. 2017. PMID: 28506470 Free PMC article.
-
A proof of concept treatment planning study of gated proton radiotherapy for cardiac soft tissue sarcoma.Phys Imaging Radiat Oncol. 2021 Jul 23;19:78-84. doi: 10.1016/j.phro.2021.06.001. eCollection 2021 Jul. Phys Imaging Radiat Oncol. 2021. PMID: 34368473 Free PMC article.
-
Topical issue: multimodality imaging in atherosclerosis.Int J Cardiovasc Imaging. 2016 Jan;32(1):1-3. doi: 10.1007/s10554-015-0774-z. Epub 2015 Oct 5. Int J Cardiovasc Imaging. 2016. PMID: 26438168 No abstract available.
References
-
- Achenbach S, Moshage W, Ropers D, Nossen J, Daniel WG. Value of electron-beam computed tomography for the noninvasive detection of high-grade coronary-artery stenoses and occlusions. N Engl J Med. 1998;339:1964–1971. - PubMed
-
- Reddy GP, Chernoff DM, Adams JR, Higgins CB. Coronary artery stenoses: assessment with contrast-enhanced electron-beam CT and axial reconstructions. Radiology. 1998;208:167–172. - PubMed
-
- Little WC, Downes TR, Applegate RJ. Invasive evaluation of left ventricular diastolic performance. Herz. 1990;15:362–376. - PubMed
-
- Leschka S, Husmann L, Desbiolles LM, et al. Optimal image reconstruction intervals for non-invasive coronary angiography with 64-slice CT. Eur Radiol. 2006;16:1964–1972. - PubMed
-
- Bley TA, Ghanem NA, Foell D, et al. Computed tomography coronary angiography with 370-millisecond gantry rotation time: evaluation of the best image reconstruction interval. J Comput Assist Tomogr. 2005;29:1–5. - PubMed
MeSH terms
Grants and funding
LinkOut - more resources
Full Text Sources
Other Literature Sources
Medical
