. 2015 Nov;25(11):1703-14.
doi: 10.1101/gr.192542.115. Epub 2015 Sep 2.

Zelda overcomes the high intrinsic nucleosome barrier at enhancers during Drosophila zygotic genome activation

Affiliations

Zelda overcomes the high intrinsic nucleosome barrier at enhancers during Drosophila zygotic genome activation

Yujia Sun et al. Genome Res. 2015 Nov.

Abstract

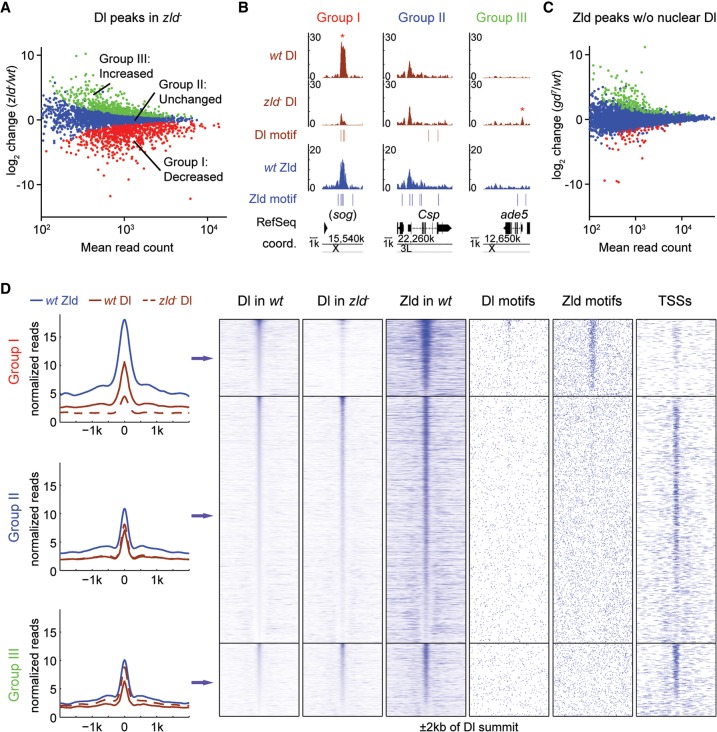
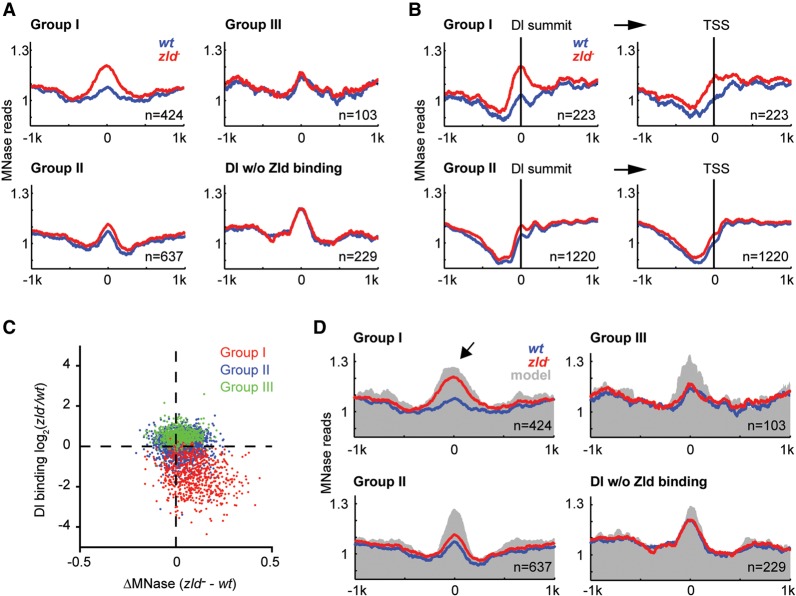
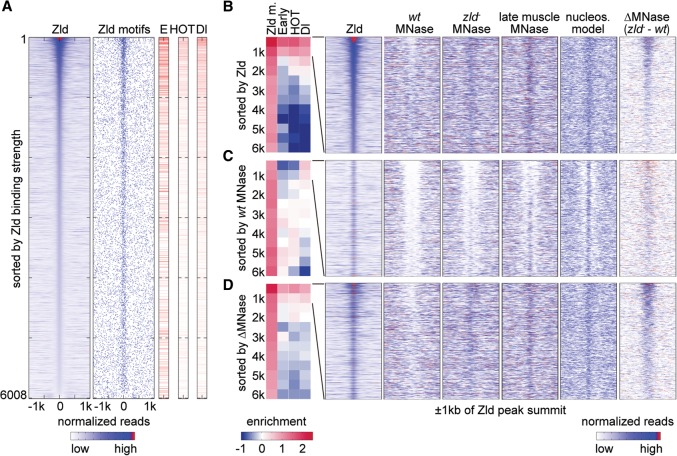
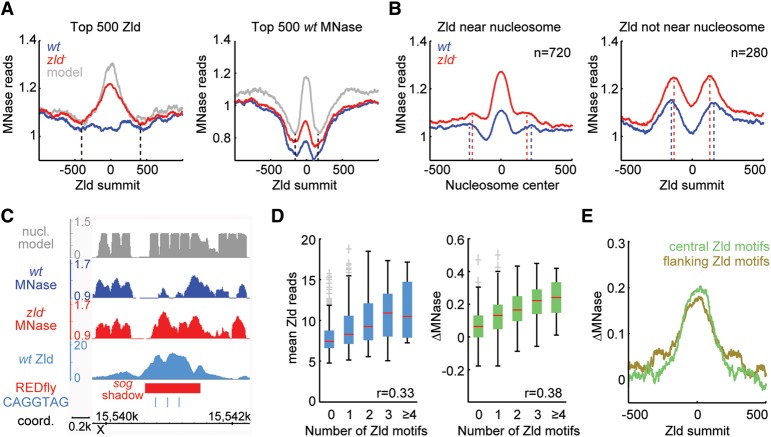
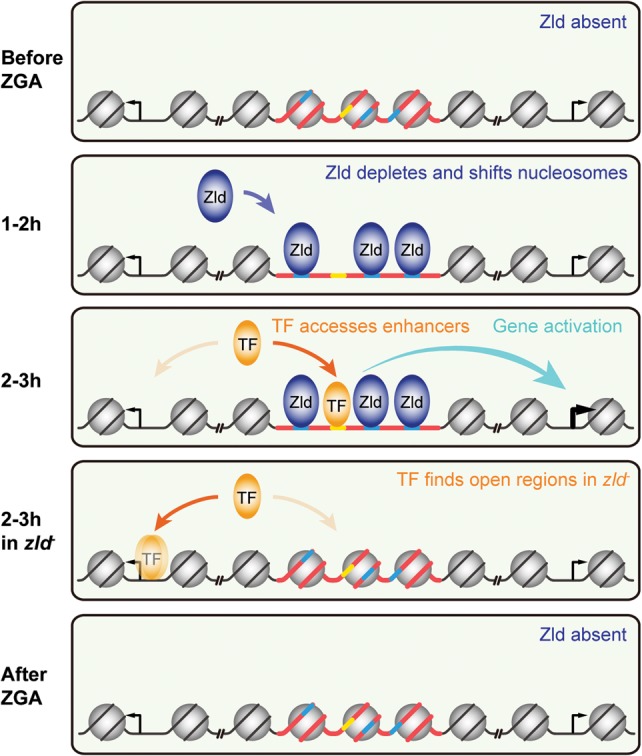
The Drosophila genome activator Vielfaltig (Vfl), also known as Zelda (Zld), is thought to prime enhancers for activation by patterning transcription factors (TFs). Such priming is accompanied by increased chromatin accessibility, but the mechanisms by which this occurs are poorly understood. Here, we analyze the effect of Zld on genome-wide nucleosome occupancy and binding of the patterning TF Dorsal (Dl). Our results show that early enhancers are characterized by an intrinsically high nucleosome barrier. Zld tackles this nucleosome barrier through local depletion of nucleosomes with the effect being dependent on the number and position of Zld motifs. Without Zld, Dl binding decreases at enhancers and redistributes to open regions devoid of enhancer activity. We propose that Zld primes enhancers by lowering the high nucleosome barrier just enough to assist TFs in accessing their binding motifs and promoting spatially controlled enhancer activation if the right patterning TFs are present. We envision that genome activators in general will utilize this mechanism to activate the zygotic genome in a robust and precise manner.


Figures

Figure 1.
Figure 1.
In the absence of Zld, Dl is lost at developmental enhancers and redistributes to accessible regions such as promoters. (A) MA plot of differential Dl binding in zld versus wild-type (wt) embryos. The x-axis represents the mean of normalized Dl reads per peak; the y-axis represents the log2 fold-change of normalized reads per peak between the genotypes. Significantly decreased peaks (Group I, red), not significantly changed peaks (Group II, blue), and significantly increased peaks (Group III, green) were identified by DESeq with FDR < 0.1. (B) Integrated genome browser (IGB) views showing examples of Dl peaks (brown tracks) within the three Dl-peak groups (y-axis represents normalized read counts), together with nearby Zld binding (blue track), as well as Dl and Zld motifs. For the sog locus, the shadow enhancer that lies ∼20 kb upstream of the TSS is shown (Hong et al. 2008). Asterisks denote peaks significantly changed in zld. (C) MA plot as shown in A of differential Zld binding in gd7 (in which no Dl activation occurs) versus wt embryos. The number of significantly changed peaks is much smaller. (D) Metaprofiles and heatmaps of normalized Dl and Zld ChIP reads for each Dl-peak group, along with nearby Dl and Zld motifs, and annotated TSSs. All regions are centered on the Dl summit (in wt) and extend to each side by 2 kb. Note that wt Dl binding within Groups II and III is on average much lower than within Group I. Note also that only Group I is highly enriched for Dl and Zld motifs and has significantly less TSSs than the other two groups, consistent with the hypothesis that they are enriched for enhancer regions.
Figure 2.
Figure 2.
Loss of Dl binding in the absence of Zld is associated with increased nucleosome occupancy. Nucleosome occupancy was measured by MNase-seq (see Methods). (A) Metaprofiles (wt in blue, zld in red) of Zld-bound Dl peaks that are >1 kb away from a TSS are shown for the three Dl-peak groups, as well as Dl peaks that do not colocalize with Zld binding as control. The normalized MNase reads were aligned at the Dl summit, and average reads within 1 kb distance are shown. (B) Metaprofiles of Zld-bound Dl peaks that are ≤1 kb away from a TSS are shown for Groups I and II. The normalized MNase reads were either aligned at Dl summits (left) or the nearby TSSs (right). Note that the increased nucleosome occupancy in zld within Group I is much more pronounced on the left, arguing that the effect is directly due to Zld binding and not due to loss of transcription at these genes. (C) Scatter plot showing the correlation between ΔMNase (x-axis) and the fold change in Dl binding (y-axis) between zld and wt embryos. Values were calculated using the reads within 125 or 250 bp of the Dl summit for Dl binding and MNase, respectively. Note the strong correlation for Group I Dl peaks (red). (D) Metaprofiles of the Dl-peak groups as in A, but with the addition of the average predicted nucleosome occupancy based on the underlying DNA sequence (gray) using a published prediction model (Xi et al. 2010). Note that the high and broad nucleosome occupancy of Group I regions in zld is also predicted by the model (arrow), indicating that the role of Zld may be to tackle the intrinsically strong nucleosome barrier of 4–5 nucleosomes at these places, which would then help Dl access these regions.
Figure 3.
Figure 3.
Zld binding and changes in nucleosome occupancy correlate with early enhancer activity. Analysis of 6008 Zld-bound regions that are >1 kb away from a TSS. In the heatmaps, normalized MNase-seq and ChIP-seq data for each region are aligned to the Zld summit, and 1-kb regions to each side are shown. (A) All 6008 non-TSS Zld-bound regions ranked by Zld summit reads from high to low show that Zld binding strongly correlates with Zld motifs and that the higher the Zld peak ranks, the more frequently early enhancers (E), HOT regions (HOT), and Dl peaks (Dl) overlap. The Zld peak rank also correlates with the degree of hotness, i.e., the number of TFs bound, and Dl binding strength, which are shown as degree of red in the same data. White indicates non-HOT regions. (BD) The 6008 Zld-bound regions are ranked by Zld summit reads from high to low as in A (B); wt MNase (within 250 bp of Zld summits) from low to high (C), and ΔMNase (the read count difference between zld and wt) from high to low (D). The ranked data were then divided into bins of 500 regions (except for the last bin, which has 508 regions), and enrichment values for each bin are shown (blue for depletion and red for enrichment). The enrichment of Zld motifs (Zld m.) was calculated over genome background, while the enrichment of early enhancers (Early), HOT regions (HOT), and Dl peaks (Dl) was calculated over the average of the 6008 Zld-bound regions. Note that the enrichment at the top two bins is strongest when ranked by Zld summit reads, still strong when ranked by ΔMNase, and the lowest when ranked by wt MNase. Heatmaps for the top two bins (1000 regions) in each ranking is shown to the right for the following data: Zld binding, wt MNase, zld MNase, MNase profiles of 14–17 h muscle tissue (late muscle MNase), predicted nucleosome model (nucleos. model) (Xi et al. 2010), and ΔMNase. Note that the nucleosome occupancy in zld embryos resembles that of late muscle tissue, where Zld is also absent, as well as the predicted model, suggesting that in the absence of Zld, nucleosome occupancy is governed by DNA sequence features.
Figure 4.
Figure 4.
The effect of Zld on nucleosome occupancy is predominantly local. (A) Metaprofiles of nucleosome occupancy for the top 500 non-TSS Zld-bound regions as in Figure 3B, which are enriched for early enhancers (left), and the top 500 wt MNase regions (the most open regions) as in Figure 3C (right). For both plots, normalized MNase reads for wt (blue) and zld (red), as well as the predicted nucleosome occupancy (gray) (Xi et al. 2010), were aligned to the Zld summits. Note the difference in width of the region with high nucleosome occupancy (black vertical dashed lines), suggesting that early enhancers have extended regions of high nucleosome occupancy. (B) Nucleosome positions in zld MNase data were identified for the top 1000 non-TSS Zld-bound regions using the nucleR package (Flores and Orozco 2011). If the Zld summit mapped within 75 bp of a nucleosome center (n = 720), the normalized MNase data for wt (blue) and zld (red) were aligned at the center of that nearest nucleosome (left). For the remaining Zld-bound regions without a nucleosome within 75 bp (n = 280), the data were aligned at Zld summits (right). Note that in both plots, there is a notable shift for the nucleosome phasing between wt (blue) and zld (red), indicated by dashed lines. (C) IGB views showing predicted nucleosome model (gray track), wt MNase (blue track), zld MNase (red track), Zld binding (light blue track), REDfly enhancer (red rectangle), and CAGGTAG Zld motifs (light blue vertical lines) at the sog shadow enhancer region. (D) Box-and-whisker plots showing Zld binding (as mean ChIP reads; left) and ΔMNase (the read count difference between zld and wt; right) for the top 1000 non-TSS Zld peaks dependent on the number of Zld motifs within 125 bp of the Zld summits. The whiskers denote the interquartile range, and gray crosses mark outliers. Note that Zld binding and ΔMNase increase approximately linearly with increasing numbers of Zld motifs. (E) Metaprofiles of ΔMNase for regions with different configurations of Zld motifs among the top 1000 non-TSS Zld peaks. Regions with only 1 Zld motif within 125 bp of the Zld summit and at least one more Zld motif within 400 bp (flanking Zld motifs group; olive) have a wider profile than those with at least 2 Zld motifs confined within 125 bp of Zld summit and no more Zld motifs within 400 bp of the Zld summit (central Zld motifs group; green). Also note that the changes in nucleosome occupancy (ΔMNase) in the central Zld motif group, where the effect of Zld is confined, are strongest within 250 bp (1–2 nucleosomes) from the Zld summit, suggesting that Zld acts predominantly local.
Figure 5.
Figure 5.
Model of Zld's role on TF specific binding and enhancer activation. When Zld is absent before ZGA, enhancers (red bold line) bearing Zld motifs (blue bold line) and other TF motifs (yellow bold line) are covered by nucleosomes (gray circle) due to intrinsic nucleosomal preference (as far as nucleosome formation can occur during the rapid nuclear division cycles). Once Zld is present (dark blue oval), Zld binding to its motifs leads to local nucleosome depletion and possibly nucleosome shifting, which exposes the motifs of other TFs within the same enhancer. Patterning TFs (orange oval) can now access their motifs, which may lead to enhancer activation (cyan arrow). In zld embryos, TFs are occluded from binding due to the high intrinsic nucleosome barrier at enhancers. Instead, excess TFs now bind nonspecifically (fuzzy orange oval) to open regions without cognate motifs, such as promoters. As development proceeds and Zld protein levels diminish in most late embryonic tissues, Zld decommissions from binding and TF motifs are again occluded from TF access.

References

    1. Adams CC, Workman JL. 1995. Binding of disparate transcriptional activators to nucleosomal DNA is inherently cooperative. Mol Cell Biol 15: 1405–1421. - PMC - PubMed
    1. Anders S, Huber W. 2010. Differential expression analysis for sequence count data. Genome Biol 11: R106. - PMC - PubMed
    1. Arnosti DN, Kulkarni MM. 2005. Transcriptional enhancers: intelligent enhanceosomes or flexible billboards? J Cell Biochem 94: 890–898. - PubMed
    1. Barozzi I, Simonatto M, Bonifacio S, Yang L, Rohs R, Ghisletti S, Natoli G. 2014. Coregulation of transcription factor binding and nucleosome occupancy through DNA features of mammalian enhancers. Mol Cell 54: 844–857. - PMC - PubMed
    1. Berman BP, Pfeiffer BD, Laverty TR, Salzberg SL, Rubin GM, Eisen MB, Celniker SE. 2004. Computational identification of developmental enhancers: conservation and function of transcription factor binding-site clusters in Drosophila melanogaster and Drosophila pseudoobscura. Genome Biol 5: R61. - PMC - PubMed

Publication types

MeSH terms

Associated data