. 2015 Sep 2;87(5):1063-77.
doi: 10.1016/j.neuron.2015.08.019.

Distinct Subpopulations of Nucleus Accumbens Dynorphin Neurons Drive Aversion and Reward

Affiliations

Distinct Subpopulations of Nucleus Accumbens Dynorphin Neurons Drive Aversion and Reward

Ream Al-Hasani et al. Neuron. .

Abstract

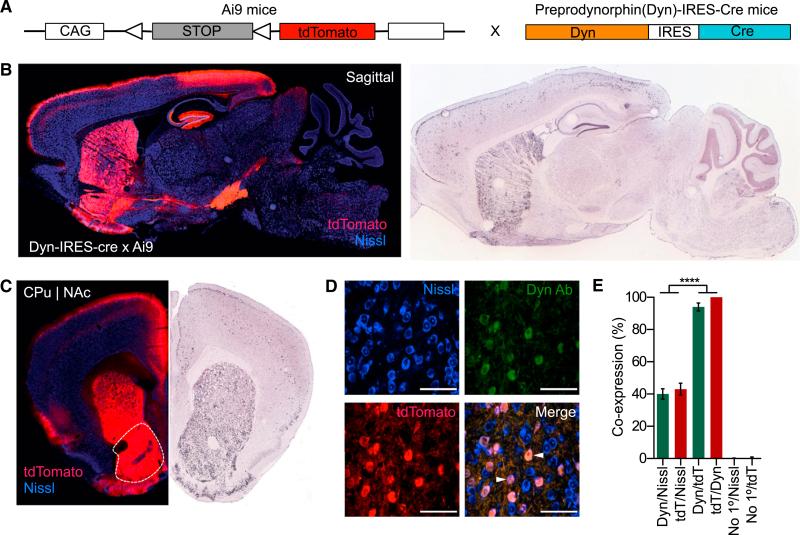
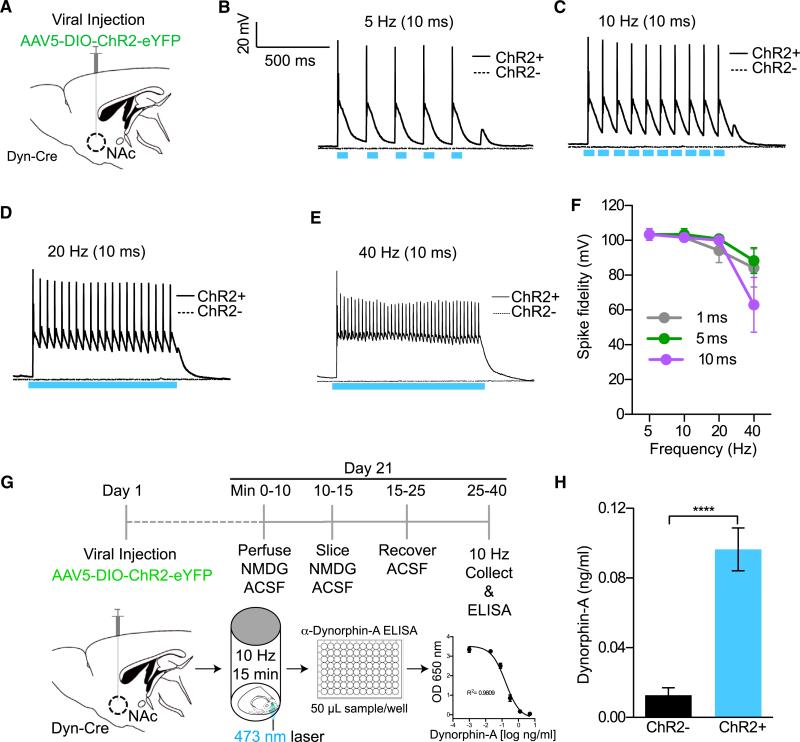
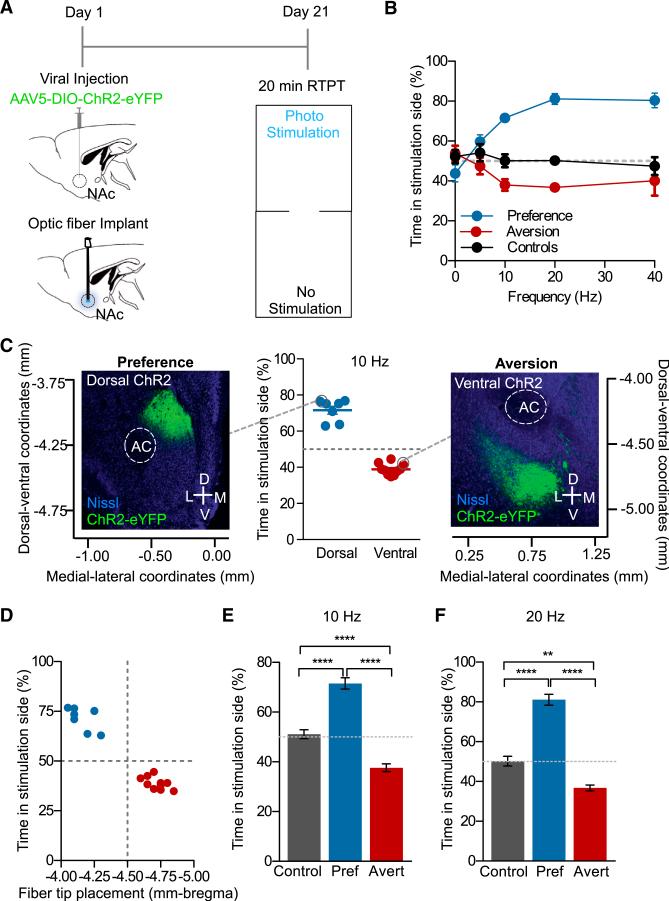
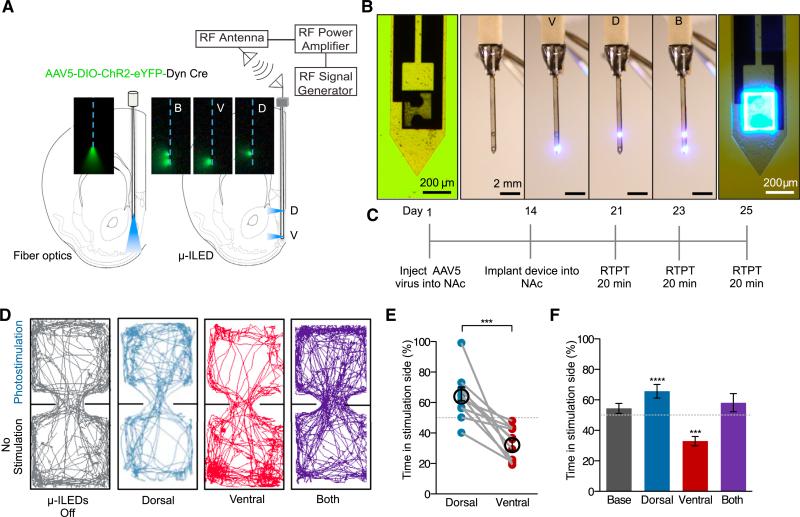
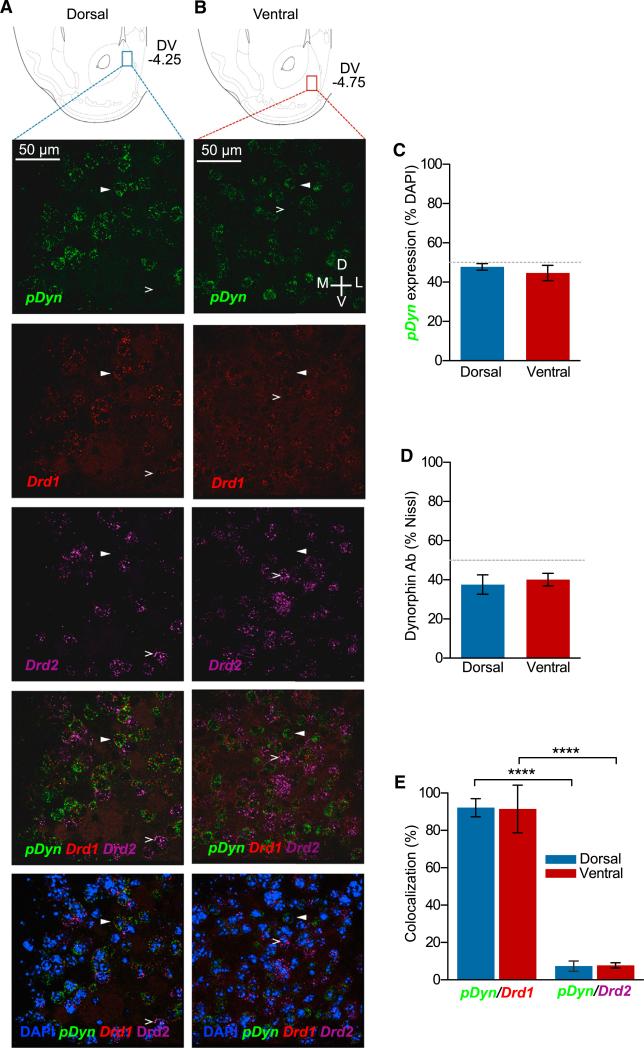
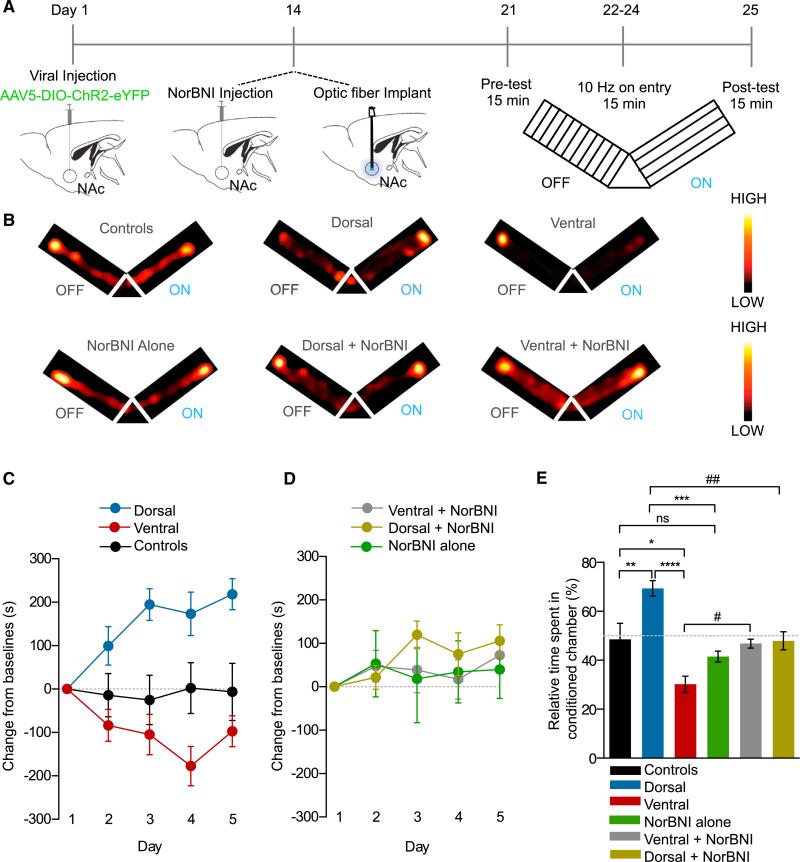
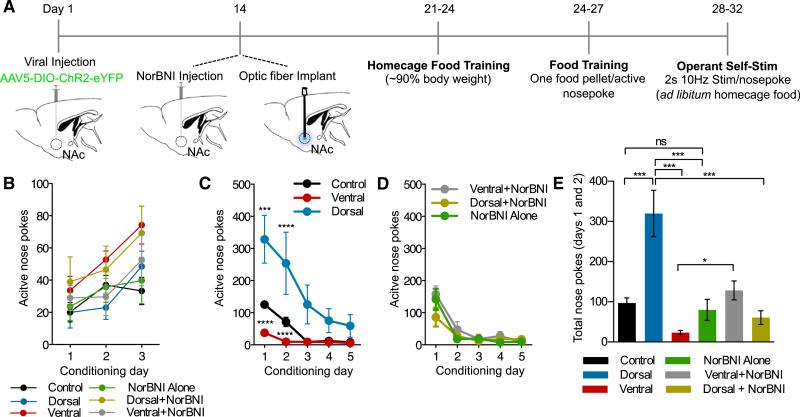
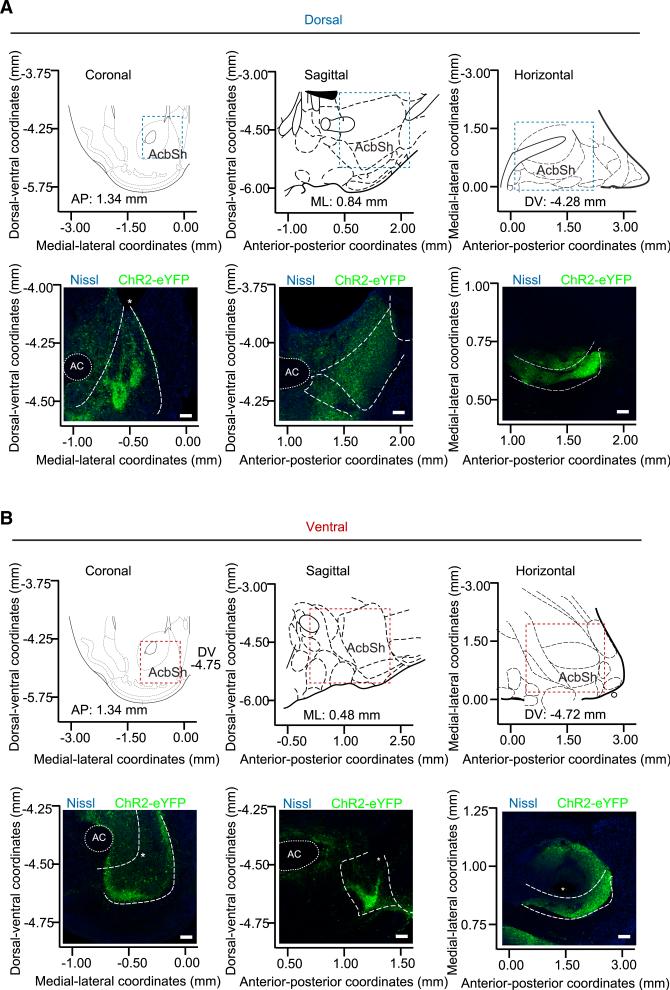
The nucleus accumbens (NAc) and the dynorphinergic system are widely implicated in motivated behaviors. Prior studies have shown that activation of the dynorphin-kappa opioid receptor (KOR) system leads to aversive, dysphoria-like behavior. However, the endogenous sources of dynorphin in these circuits remain unknown. We investigated whether dynorphinergic neuronal firing in the NAc is sufficient to induce aversive behaviors. We found that photostimulation of dynorphinergic cells in the ventral NAc shell elicits robust conditioned and real-time aversive behavior via KOR activation, and in contrast, photostimulation of dorsal NAc shell dynorphin cells induced a KOR-mediated place preference and was positively reinforcing. These results show previously unknown discrete subregions of dynorphin-containing cells in the NAc shell that selectively drive opposing behaviors. Understanding the discrete regional specificity by which NAc dynorphinerigic cells regulate preference and aversion provides insight into motivated behaviors that are dysregulated in stress, reward, and psychiatric disease.


Figures

Figure 1
Figure 1. Dyn-tdTomato-Reporter Mouse Allows Visualization of Dynorphin-Containing Cells
(A) Diagram showing the generation of the dyn-CretdTomato mouse line from the cross between the dyn-IRES-cre × Ai9-tdTomato. (B) Dyn labeling in dyn-IRES-cre × Ai9-tdTomato compared to in situ images from the Allen Institute for Brain Science in a sagittal section highlighting presence of dyn in the striatum, the hippocampus, BNST, amygdala, hippocampus, and substantia nigra. All images show tdTomato (red) and Nissl (blue) staining. (C) Coronal section highlighting dynorphinergic cell labeling in the NAc as compared to the Allen Institute for Brain Science. (D) Images of nissl (blue), tdtomato (red), and dyn (green) and a merge of all three in the NAcSh (63× magnification) (AP+1.3, ML ±0.5, DV–4.5). All scale bars are 100 μm. (E) Cells labeled with anti-dyn antisera also all express tdtomato represented as co-expression (%). This is significant when compared to dyn/nissl co-localization (data represented as mean ± SEM, n = 3 slices per animal from three animals per group: one way ANOVA, Bonferroni post hoc, dyn/nissl versus dyn/tdtomato, dyn/nissl versus no1°/Nissl, tdTomato/Nissl td/Tomato/dyn, and tdTomato/Dyn versus no1°/tdTomato, ****p < 0.0001).
Figure 2
Figure 2. Photostimulation of Dyn-Containing Cells Elicits Action Potential Firing and Release of Dynorphin
(A) Cartoon of virus and fiber optic placement. (B–E) Whole-cell slice recording showing light-evoked action potentials in dyn-cre ChR2+ and ChR2 cells in the vNAcSh using a 10-ms pulse width at 5, 10, 20, and 40 Hz. (F) Summary graph showing loss of spike fidelity at 40 Hz and no apparent change in spike fidelity at 1, 5, or 10 ms pulse width. (G) Timeline used to collect samples and measure dyn release using an ELISA protocol. (H) Photostimulation of dyn-expressing ChR2+ cells in the NAcSh increases the concentration of dyn when compared to non-ChR2-expressing cells in dyn-cre animals (data represented as mean ± SEM, n = 2/group with eight replicates in each group: Student's t test ****p < 0.0001).
Figure 3
Figure 3. Activation of Dynorphinergic Cells in the NAcSh Drives Both Aversion and Reward
(A) Calendar outlining experimental procedure of the RTPT. (B) Frequency response curve (10, 20, and 40 Hz stimulation; 10 ms pulse width) showing two distinctly responding groups. One group spent significantly more time in the photostimulation side (preference), and the other spent more time in the non-stimulated side aversion (data represented as mean ± SEM, n = 7–10). (C) Scatter plot of individual mice that exhibit a preference behavior, show dorsal ChR2 expression, or an aversion behavior, show more ventral ChR2 expression, following 10 Hz, 10 ms pulse width photostimulation (n = 7–10). Nissl (blue) and ChR2 (green). (D) Scatter plot showing the level of preference in each individual mouse is positively correlated with fiber tip placement (data represented as mean ± SEM, n = 7–10: Spearman positive correlation, r = 0.8895). (E) At 10 Hz preferers and averters show a significant preference or aversion compared to each another and controls (data represented as mean ± SEM, n = 5–11: one-way ANOVA, Bonferroni post hoc, control versus preferers ****p < 0.0001, control versus averters ****p < 0.01, preferers versus averters ****p < 0.0001). (F) At 20 Hz preferers and averters show a significant preference or aversion compared to one another and controls (data represented as mean ± SEM, n = 6: one-way ANOVA, Bonferroni post hoc, control versus preferers ****p < 0.0001, control versus averters **p < 0.001, preferers versus averters ****p < 0.0001).
Figure 4
Figure 4. Discrete Spatial Targeting Drives Preference and Aversion in the Same Animal
(A) Directionally controlled light spread of μ-ILED devices compared to fiber optics for isolating subregions of NAc as demonstrated in the fluorescein. (B) Images of an ultrathin (~10–50 μm), flexible integrated system. Light can be isolated to either dorsal or ventral NAcSh (C) Behavioral calendar of the experimental procedure. (D) Examples of real-time mouse behavioral traces following no stimulation, ventral or dorsal wireless photostimulation, and ventral and dorsal photostimulation together. (E) Aversion and preference real-time behavior following stimulation of the ventral and dNAcSh within each individual mouse (data represented as mean ± SEM, n = 11: Student's t test, ***p < 0.001). (F) Stimulation with dorsal μ-ILED drives a real-time place preference, but stimulation with ventral μ-ILED drives an aversion, measured as a significant increase or decrease in time spent in the stimulation side (%), respectively. Stimulating both ventral and dorsal μ-ILEDs has no significant effect on behavior. (Data represented as mean ± SEM, n = 11: one sampled Student's t test; ****p < 0.0001 dorsal and ***p < 0.001 ventral.)
Figure 5
Figure 5. Dyn mRNA+ Neurons Colocalize with Drd1+ Neurons, but Not with Drd2+ Neurons in Both the Dorsal and vNAcSh
(A) Cartoon depicting the anatomical location of the dorsal (blue) subregion of the NAcSh corresponding to images as well as quantification. Representative 40× images of pDyn (green), Drd1 (red), and Drd2 (purple) mRNA expression in the dorsal shell. (B) Cartoon depicting the anatomical location of the ventral (red) subregions of the NAcSh corresponding to microscope images as well as quantification. Representative 40× images of pDyn (green), Drd1 (red), and Drd2 (purple) mRNA expression in the ventral shell. (C) No significant difference in dyn mRNA-expressing neurons between the dNAcSh and vNAcSh. (D) No significant difference in anti-dyn antisera-positive cells in the dNAcSh or vNAcSh (data represented as mean ± SEM, n = 3). (E) Dorsal and ventral NAcSh dyn mRNA+ neurons show increased colocalization with Drd1-containing neurons compared to Drd2-containing neurons. (Data represented as mean ± SEM, n = 5, ****p < .0001, one-way ANOVA, Bonferroni post hoc.)
Figure 6
Figure 6. Preference and Aversion Following Photostimulation of Dyn-Containing Neurons in the Dorsal and vNAcSh Requires KOR Activity
(A) Calendar outlining the Y-maze paradigm. (B) Representative activity heat maps from all groups during post-test. (C) Change from baseline in dorsal, ventral, and control mice measured across all 5 days of the Y-maze paradigm (data represented as mean ± SEM, n = 8–13, two-way ANOVA, interaction effect between groups and days, p < 0.0001). (D) Change from baseline in NorBNI+dorsal, NorBNI+ventral, and NorBNI alone mice measured across all 5 days of the Y-maze paradigm (data represented as mean ± SEM, n = 8–13). (E) Change in percent time spent in conditioned arm of the Y-maze in all groups (data represented as mean ± SEM, n = 8–13; one-way ANOVA, Bonferroni post hoc, control versus dorsal **p < 0.01, Control versus ventral *p < 0.05, dorsal versus ventral ****p < 0.0001, control versus NorBNI alone ns, dorsal versus NorBNI ***p < 0.001, dorsal versus dorsal+NorBNI ##p < 0.01, ventral versus ventral NorBNI #p < 0.05).
Figure 7
Figure 7. Distinct NAc Dyn Populations in Operant Stimulation Produce Positive and Negative Responses
(A) Calendar outlining the operant self-stimulation paradigm. (B) No significant difference in active nose pokes for food reward between all groups (data represented as mean ± SEM, n = 6 to 7). (C) Data showing number of nose pokes across 5 day of operant self-stimulation. Dorsally injected mice show significantly increased active nose pokes, compared to controls and ventrally injected mice, which show a significant reduction in nose pokes following photostimulation (data represented as mean ± SEM, n = 6 to 7: two way repeated-measures ANOVA, Bonferroni post hoc; dorsal versus controls on day 1 ***p < 0.001, dorsal versus controls on day 2 **p < 0.001, dorsal versus ventral on day 1 and 2 ****p < 0.0001.) (D) Data showing number of nose pokes across 5 days of operant self-stimulation with no significant differences between ventral+NorBNI, dorsal+NorBNI, and NorBNI alone (data represented as mean ± SEM, n = 6 to 7). (E) Significant differences in total nose pokes on day 1 and day 2 following photostimulation (data represented as mean ± SEM, n = 6 to 7: one-way ANOVA, Bonferroni post hoc; control versus dorsal ***p < 0.0001, dorsal versus ventral ***p < 0.0001, ventral versus ventral+NorBNI *p < 0.01, dorsal versus dorsal+NorBNI, dorsal versus NorBNI alone ***p < 0.001, control versus NorBNI alone ns). Representative 60-min trials for each group.
Figure 8
Figure 8. Characterization of Viral Expression and Fiber Placement throughout the NAc
(A and B) Coronal, sagittal, and horizontal views documenting NAc dyn-dependent viral expression in dorsally injected mice (A) that demonstrated reward-like behaviors and ventrally injected mice (B) that demonstrated aversion behaviors. Top panels use stereotaxic coordinates and atlas images to orient the location of bottom panels of representative confocal micrographs. Scale bars,100 μm. * indicates tissue damage from fiber placements.

Similar articles

Cited by

References

    1. Al-Hasani R, McCall JG, Foshage AM, Bruchas MR. Locus coeruleus kappa opioid receptors modulate reinstatement of cocaine place preference through a noradrenergic mechanism. Neuropsychopharmacology. 2013a;38:2484–2497. - PMC - PubMed
    1. Al-Hasani R, McCall JG, Foshage AM, Bruchas MR. Locus coeruleus kappa-opioid receptors modulate reinstatement of cocaine place preference through a noradrenergic mechanism. Neuropsychopharmacology. 2013b;38:2484–2497. - PMC - PubMed
    1. Baldo BA, Daniel RA, Berridge CW, Kelley AE. Overlapping distributions of orexin/hypocretin- and dopamine-beta-hydroxylase immuno-reactive fibers in rat brain regions mediating arousal, motivation, and stress. J. Comp. Neurol. 2003;464:220–237. - PubMed
    1. Bals-Kubik R, Herz A, Shippenberg TS. Evidence that the aversive effects of opioid antagonists and kappa-agonists are centrally mediated. Psychopharmacology (Berl.) 1989;98:203–206. - PubMed
    1. Britt JP, Benaliouad F, McDevitt RA, Stuber GD, Wise RA, Bonci A. Synaptic and behavioral profile of multiple glutamatergic inputs to the nucleus accumbens. Neuron. 2012;76:790–803. - PMC - PubMed

Publication types

MeSH terms