. 2015 Aug 27:3:e1165.
doi: 10.7717/peerj.1165. eCollection 2015.

MetaBAT, an efficient tool for accurately reconstructing single genomes from complex microbial communities

Affiliations

MetaBAT, an efficient tool for accurately reconstructing single genomes from complex microbial communities

Dongwan D Kang et al. PeerJ. .

Abstract

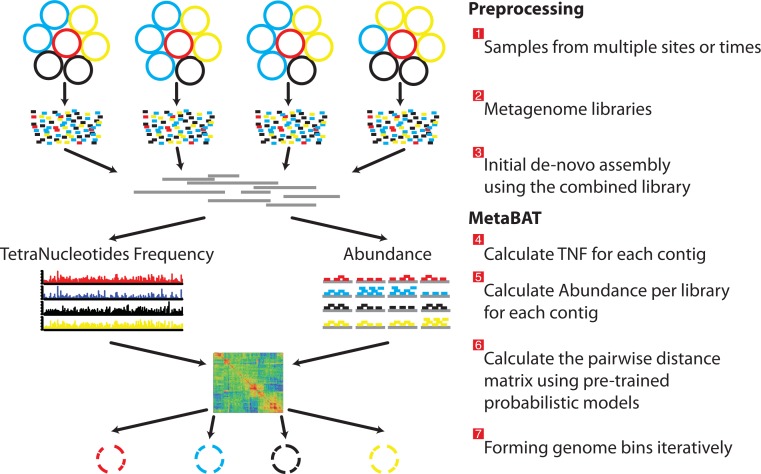
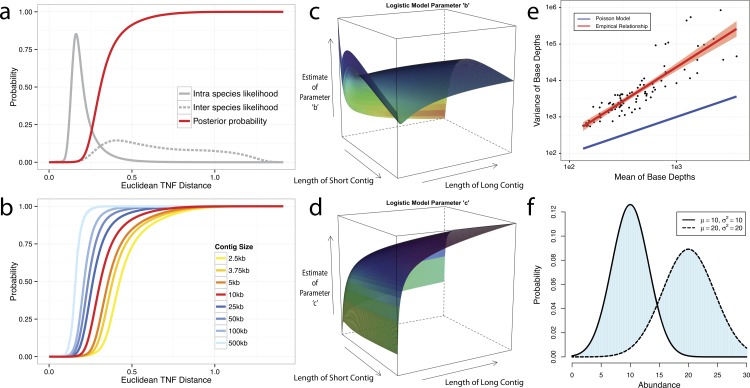
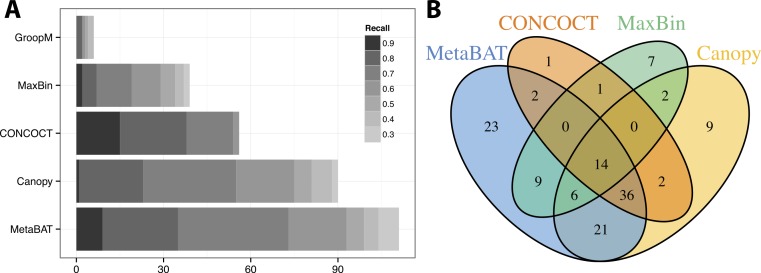
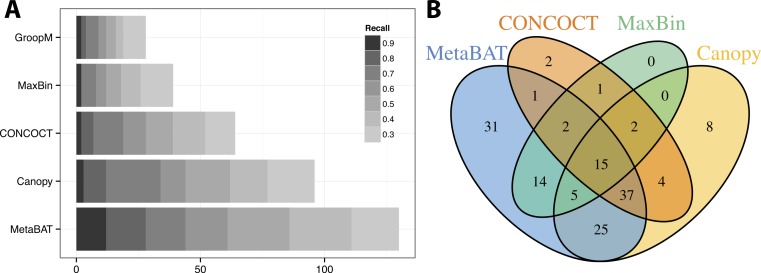
Grouping large genomic fragments assembled from shotgun metagenomic sequences to deconvolute complex microbial communities, or metagenome binning, enables the study of individual organisms and their interactions. Because of the complex nature of these communities, existing metagenome binning methods often miss a large number of microbial species. In addition, most of the tools are not scalable to large datasets. Here we introduce automated software called MetaBAT that integrates empirical probabilistic distances of genome abundance and tetranucleotide frequency for accurate metagenome binning. MetaBAT outperforms alternative methods in accuracy and computational efficiency on both synthetic and real metagenome datasets. It automatically forms hundreds of high quality genome bins on a very large assembly consisting millions of contigs in a matter of hours on a single node. MetaBAT is open source software and available at https://bitbucket.org/berkeleylab/metabat.

Keywords: MetaBAT; Metagenome binning.


Conflict of interest statement

The authors declare there are no competing interests.

Figures

Figure 1
Figure 1. Overview of the MetaBAT pipeline.
There are three preprocessing steps before MetaBAT is applied: (1) A typical metagenome experiment may contain many spatial or time-series samples, each consisting of many different genomes (different color circles). (2) Each sample is sequenced by next-generation sequencing technology to form a sequencing library with many short reads. (3) The libraries may be combined before de novo assembly. After assembly, the reads from each sample must be aligned in separate BAM files. MetaBAT then automatically performs the remaining steps: (4) For each contig pair, a tetranucleotide frequency distance probability (TDP) is calculated from a distribution modelled from 1,414 reference genomes. (5) For each contig pair, an abundance distance probability (ADP) across all the samples is calculated. (6) The TDP and ADP of each contig pair are then combined, and the resulting distance for all pairs form a distance matrix. (7) Each bin will be formed iteratively and exhaustively from the distance matrix.
Figure 2
Figure 2. Probabilistic modeling of TNF and Abundance distances.
(A–D) TNF distance modeling. (A) Empirical probabilities of intra- (solid gray line) or inter- (dotted gray line) species Euclidean TNF distance are estimated from sequenced genomes. The posterior probability of two contigs originated from different genomes given a TNF distance is shown as a red solid line. All probabilities are calculated using a fixed contig size of 10 kb. (B) Different posterior inter-species probabilities for two equal-size contigs under various contig sizes. (C, D) The estimation of parameters for a logistic curve with two contigs of different sizes. x and y axis represent the lengths of short and long contig, respectively, and z axis represents the estimates of each parameter b or c in a logistic curve, TDP = 1/(1 + exp(−(b + c∗TNF))), where TNF and TDP represents the Euclidean TNF distance and probabilistic TNF distance, respectively. (E–F) Abundance distance modeling. (E) The relationship between mean and variance of base depths (coverage) which were shown in x and y axis, respectively. Each dot represents this relationship in each genome, which calculated by median of mean and variance of the coverage. Theoretical Poisson model was shown as blue line and normal model was shown as red line. (F) Probabilistic abundance distance between two contigs. The shaded area represents the abundance distance between two contigs in a given library.
Figure 3
Figure 3. Binning performance on synthetic metagenomic assemblies.
(A) The number of genomes (X-axis) identified by each binning method (Y-axis) in different recall (completeness) threshold and >90% precision, which calculates the lack of contamination. (B) Venn diagram of identified genomes by top 4 binning methods.
Figure 4
Figure 4. Binning performance on real metagenomic assemblies.
(A) The number of genomes (X-axis) identified by each binning method (Y-axis) in different recall (completeness) threshold and >90% precision, which calculates the lack of contamination. (B) Venn diagram of identified genomes by top 4 binning methods.
Figure 5
Figure 5. Comparison between MetaBAT bins after post-processing and MGS draft genomes from Nielsen et al.
(A) Venn diagram of identified genome bins by MetaBAT having >90% precision and >30% completeness calculated by CheckM and one-to-one corresponding genomes in MGS draft genomes. (B) Scatterplot of completeness and precision for MetaBAT genome bins when considered MGS draft genomes as the gold standard. X-axis represents shared proportion of bases in terms of MetaBAT bins (i.e., precision), and y-axis represents shared proportion of bases in terms of MGS genomes (i.e., completeness). Each circle represents a unique MetaBAT bins having uniquely corresponding MGS genomes (342 bins in total), and the size of it corresponds to bin size.

References

    1. Albertsen M, Hugenholtz P, Skarshewski A, Nielsen KL, Tyson GW, Nielsen PH. Genome sequences of rare, uncultured bacteria obtained by differential coverage binning of multiple metagenomes. Nature Biotechnology. 2013;31:533–538. doi: 10.1038/nbt.2579. - DOI - PubMed
    1. Alneberg J, Bjarnason BS, de Bruijn I, Schirmer M, Quick J, Ijaz UZ, Lahti L, Loman NJ, Andersson AF, Quince C. Binning metagenomic contigs by coverage and composition. Nature Methods. 2014;11:1144–1146. doi: 10.1038/nmeth.3103. - DOI - PubMed
    1. Benjamini Y, Speed TP. Summarizing and correcting the GC content bias in high-throughput sequencing. Nucleic Acids Research. 2012;40:e1165. doi: 10.1093/nar/gks001. - DOI - PMC - PubMed
    1. Boisvert S, Raymond F, Godzaridis E, Laviolette F, Corbeil J. Ray Meta: scalable de novo metagenome assembly and profiling. Genome Biology. 2012;13:e1165. doi: 10.1186/gb-2012-13-12-r122. - DOI - PMC - PubMed
    1. Clark SC, Egan R, Frazier PI, Wang Z. ALE: a generic assembly likelihood evaluation framework for assessing the accuracy of genome and metagenome assemblies. Bioinformatics. 2013;29:435–443. doi: 10.1093/bioinformatics/bts723. - DOI - PubMed

LinkOut - more resources