. 2015 Oct 6;6(30):30178-93.
doi: 10.18632/oncotarget.4903.

Functional, chemical genomic, and super-enhancer screening identify sensitivity to cyclin D1/CDK4 pathway inhibition in Ewing sarcoma

Affiliations

Functional, chemical genomic, and super-enhancer screening identify sensitivity to cyclin D1/CDK4 pathway inhibition in Ewing sarcoma

Alyssa L Kennedy et al. Oncotarget. .

Abstract

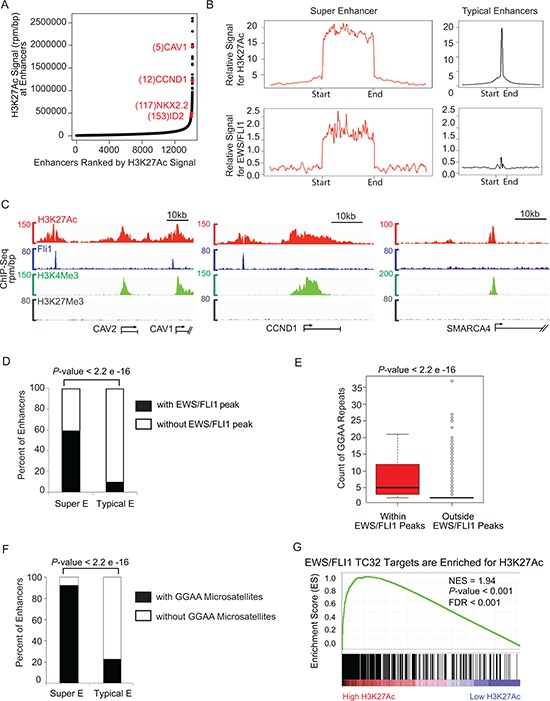
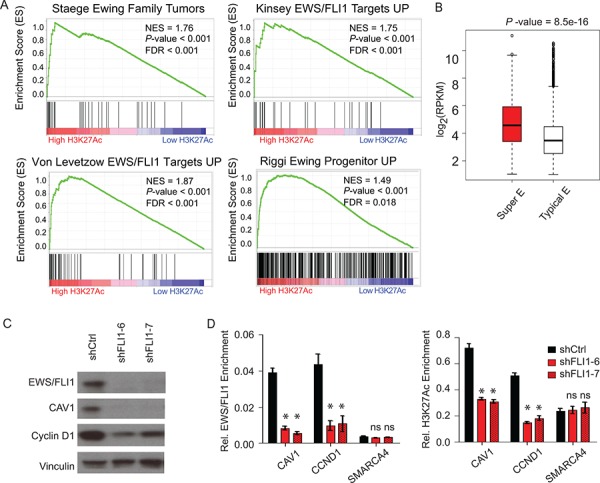
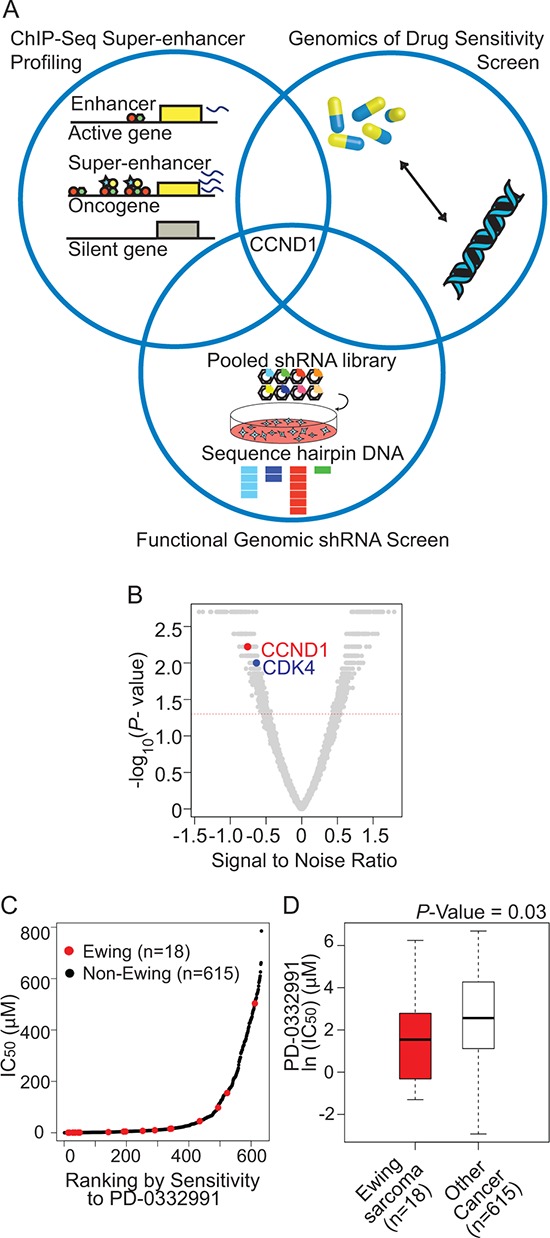
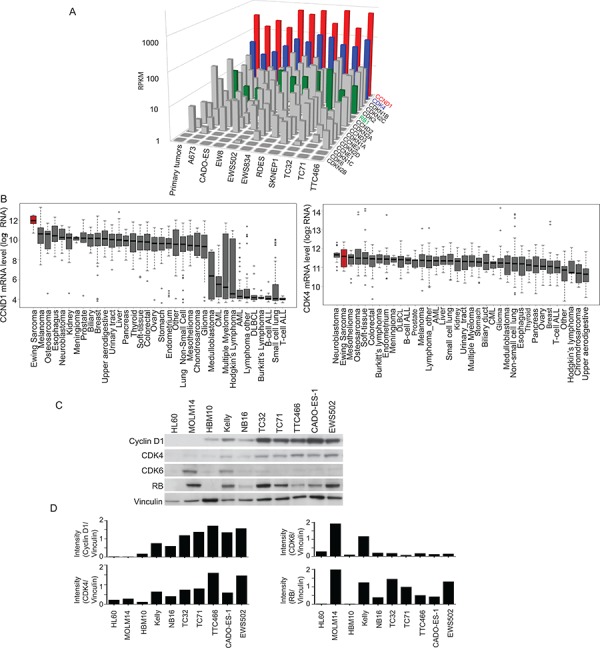
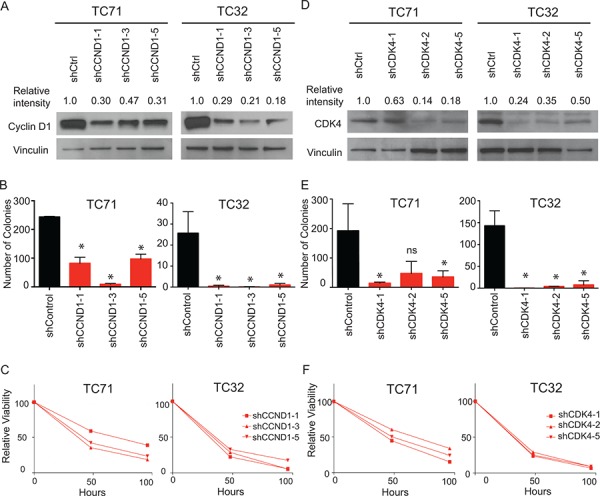
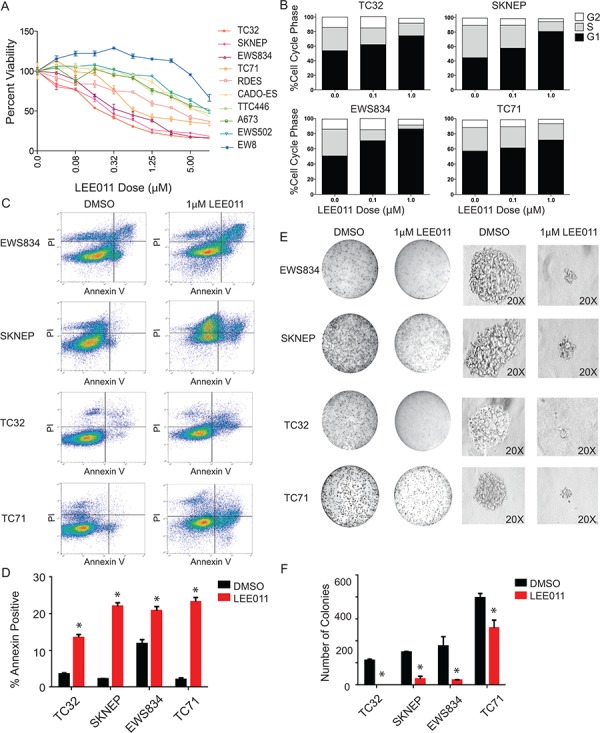
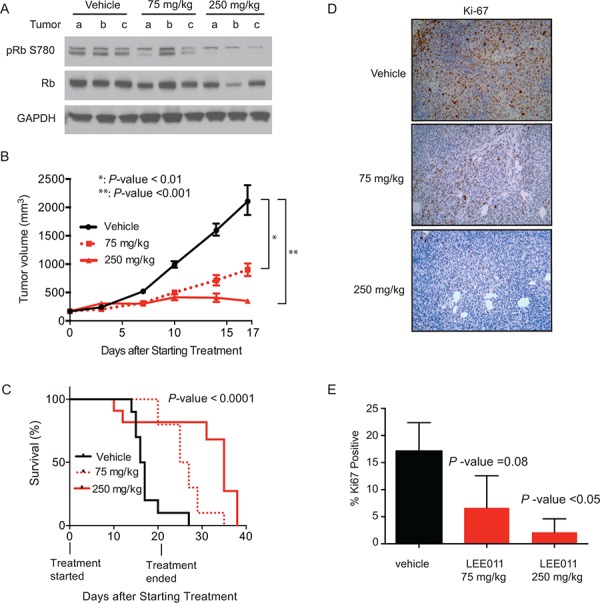
Ewing sarcoma is an aggressive bone and soft tissue tumor in children and adolescents, with treatment remaining a clinical challenge. This disease is mediated by somatic chromosomal translocations of the EWS gene and a gene encoding an ETS transcription factor, most commonly, FLI1. While direct targeting of aberrant transcription factors remains a pharmacological challenge, identification of dependencies incurred by EWS/FLI1 expression would offer a new therapeutic avenue. We used a combination of super-enhancer profiling, near-whole genome shRNA-based and small-molecule screening to identify cyclin D1 and CDK4 as Ewing sarcoma-selective dependencies. We revealed that super-enhancers mark Ewing sarcoma specific expression signatures and EWS/FLI1 target genes in human Ewing sarcoma cell lines. Particularly, a super-enhancer regulates cyclin D1 and promotes its expression in Ewing sarcoma. We demonstrated that Ewing sarcoma cells require CDK4 and cyclin D1 for survival and anchorage-independent growth. Additionally, pharmacologic inhibition of CDK4 with selective CDK4/6 inhibitors led to cytostasis and cell death of Ewing sarcoma cell lines in vitro and growth delay in an in vivo Ewing sarcoma xenograft model. These results demonstrated a dependency in Ewing sarcoma on CDK4 and cyclin D1 and support exploration of CDK4/6 inhibitors as a therapeutic approach for patients with this disease.

Keywords: CDK4/6 inhibitor; Ewing sarcoma; cyclin D1; epigenetics; sarcoma/soft-tissue malignancies.


Conflict of interest statement

CONFLICTS OF INTEREST

K. Stegmaier consults for Novartis Pharmaceuticals as part of the Dana-Farber Cancer Institute/Novartis Drug Discovery Program. S. Kim and S. Parasuraman are employees of Novartis Pharmaceuticals.

Figures

Figure 1
Figure 1. Super-enhancer profiling in TC32 identifies CCND1 and other important EWS/FLI1 targets
A. Total H3K27Ac ChIP-seq signal in units of reads per million in enhancer regions for all enhancers in TC32. Enhancers are ranked by increasing H3K27Ac ChIP-seq signal. B. Metagene representation of global H3K27Ac or EWS/FLI1 occupancy at typical enhancers and super-enhancers in TC32. Metagenes are centered on the enhancer region, and the length of the enhancer reflects the difference in median length (2 kb for typical enhancers, 33 kb for super-enhancers). Additional 5 kb surrounding each enhancer is also shown. The y axis shows the relative ChIP-seq signal. C. Gene track of H3K27Ac (red), and FLI1 (blue), H3K4Me3 (green), H3K27Me3 (grey). ChIP-seq occupancy at the super-enhancer regions surrounding CAV1/2 and CCND1, and at the typical enhancer region upstream of SMARCA4. D. Fisher test showed super-enhancer regions have significantly more EWS/FLI1 peaks than typical enhancer regions (odd ratio =15.8, P-value < 2.2 x e-16.) E. Two tailed t-test showed that the GGAA microsatellites in EWS/FLI1 peaks have more GGAA repeat counts than those in other genome regions outside of the EWS/FLI1 peaks (average GGAA count in EWS/FLI1 peaks = 7.3, average GGAA count outside EWS/FLI1 peaks = 2.3, P-value < 2.2 e-16.) F. Fisher test showed super-enhancer regions have significantly more GGAA microsatellites than typical enhancer regions (odd ratio = 38.0, P-value < 2.2e-16.) G. GSEA demonstrates enrichment of H3K27Ac binding in EWS/FLI1 target genes.
Figure 2
Figure 2. Super-enhancers play important role in Ewing sarcoma biology
A. GSEA demonstrates that the Ewing family tumor gene signature and the various EWS/FLI1 target signatures are all enriched in genes with extremely high binding of H3K27Ac in the enhancer region. B. Box plots of expression values in TC32 cells for genes with proximal typical enhancers (white) or with proximal super-enhancers (red). C. mir30-shRNA-mediated knockdown of EWS/FLI1 in the TC32 cell line reduced the protein levels of the Ewing super-enhancer-associated genes CAV1 and CCND1, with vinculin as a control. D. ChIP-qPCR analysis showing that conditional EWS/FLI1 knockdown in TC32 cells reduced the relative enrichment of EWS/FLI1 and H3K27Ac in the super-enhancer regions (CAV1, CCND1) but not in the typical enhancer region (SMARCA4). *P-value < 0.01, ns: not significant.
Figure 3
Figure 3. An integrative approach to identify Ewing sarcoma specific dependencies
A. Venn diagram representing confluence of screening approaches that nominate the CDK4/cyclin D1 pathway as dependencies in Ewing sarcoma. B. Volcano plot depicting CCND1 and CDK4 as significant ATARiS depletion solutions for Ewing sarcoma compared to other cancer cell lines. Gene ranks based on signal to noise ratio (with significant P-value < 0.05), ranking: CCND1: 96, CDK4: 191 out of 4997 ATARiS solutions. C. Ranking of cell line data from Genomics of Drug Sensitivity in Cancer data: IC50 versus sensitivity to PD0332991. D. Cells expressing EWS/FLI1 have increased sensitivity (P-value = 0.03, Mann-Whitney test) to the CDK4/6 inhibitor PD0332991.
Figure 4
Figure 4. Cyclin D1 and CDK4 are highly expressed in Ewing sarcoma as compared to other tumor types
A. RNA sequencing of Ewing sarcoma cell lines shows elevated levels of CCND1 (red) and CDK4 (blue) compared to other G1 cell cycle proteins. Rb is also highly expressed (green). B. CCND1 and CDK4 are highly expressed in Ewing sarcoma cell lines, as measured by mRNA expression, when compared to a panel of other non-Ewing sarcoma cancer cell lines. C. Western blot shows expression of cyclin D1 and CDK4, as well as expression of Rb in Ewing sarcoma cell lines versus leukemia cell lines (HL60 and MOLM14), mesenchymal stem cells (HBM10) and neuroblastoma cell lines (Kelly and NB16). D. Quantification of Western blots results in panel C using NIH ImageJ.
Figure 5
Figure 5. Targeting CDK4 and cyclin D1 with shRNA mediated knockdown results in impairment in both cell growth and colony formation
A. Western blot showing decreased levels of cyclin D1 after transduction with shRNAs targeting cyclin D1 or a control. Relative intensity was quantified with NIH ImageJ. B. Decreased colony formation of cyclin D1 shRNA transduced cells versus control. Error bars represent +/− SEM of two independent experiments. *P-value < 0.05, ns: not significant. C. Relative viability over time of TC71 and TC32 cells transduced with indicated cyclin D1 targeting hairpins compared to cells transduced with control hairpin. Results were plotted as percentage of viability in cyclin D1 shRNA transduced cells compared to control shRNA transduced cells, based on the luminescent value at each timepoint. Shown is a representative of three independent experiments. D. Western blot showing decreased levels of CDK4 after transduction with shRNAs targeting CDK4 or control. Relative intensity was quantified with NIH ImageJ. E. Decreased colony formation of CDK4 shRNA transduced cells versus a control. Error bars represent +/− SEM of three independent experiments. *P-value < 0.05, ns: not significant. F. Relative viability over time of TC71 and TC32 cells transduced with indicated CDK4-targeting hairpins compared to cells transduced with a control hairpin. Results were plotted as the percentage of viability in cyclin D1 shRNA transduced cells compared to control shRNA transduced cells, based on the luminescent value at each timepoint. Shown is a representative of three independent experiments.
Figure 6
Figure 6. Pharmacologic inhibition of CDK4/6 in Ewing sarcoma results in impaired cell viability, G1 arrest and cell death in Ewing sarcoma cell lines
A. Ewing sarcoma cells treated with LEE011 for five days show sensitivity in the low micromolar range in a panel of Ewing cell lines. Cell viability was assessed using the ATP-based CellTiter-Glo Luminescent Assay. B. Treatment with LEE011 in Ewing cell lines demonstrates G1 arrest. C. Flow cytometry plots for Annexin V and PI staining in the cell lines treated with 1 μM LEE011 or DMSO for 5 days. D. Percentage of Annexin V-positive cells in the cell lines treated with 1 μM LEE011 or DMSO for 5 days. Error bar represent +/− SD of two technical replicates. *P-value < 0.05, ns: not significant. Results are representative of three independent experiments. E. Colony morphology in methylcellulose-based media with 1 μM LEE011 versus control. F. Colony counts in methylcellulose-based media with 1 μM LEE011 versus control. Results are representative of three independent experiments, with error bars representing +/− SD of two technical replicates.*P-value < 0.05, ns: not significant.
Figure 7
Figure 7. LEE011 impairs Ewing sarcoma tumor xenograft growth in vivo
A. Western blot showing LEE011 effects on the downstream target of CDK4, Rb phosphoserine 780, total Rb or GAPDH in tumor cell lysates. B. Tumor volume over time in animals treated with vehicle, LEE011 at 75 mg/kg or 250 mg/kg. C. Kaplan-Meier survival curve of control, 75 mg/kg or 250 mg/kg daily dosing of LEE011. Log-rank (Mantel-Cox) test (P-value < 0.0001) and Logrank test for trend (P-value < 0.0001) were used to calculate P-value comparing the three survival curves. D. Immunohistochemical staining for proliferation marker Ki-67. E. Quantification of Ki-67 staining compared to vehicle.

References

    1. Esiashvili N, Goodman M, Marcus RB., Jr Changes in incidence and survival of Ewing sarcoma patients over the past 3 decades: Surveillance Epidemiology and End Results data. Journal of pediatric hematology/oncology. 2008;30:425–430. - PubMed
    1. Grier HE, Krailo MD, Tarbell NJ, Link MP, Fryer CJ, Pritchard DJ, Gebhardt MC, Dickman PS, Perlman EJ, Meyers PA, Donaldson SS, Moore S, Rausen AR, Vietti TJ, Miser JS. Addition of ifosfamide and etoposide to standard chemotherapy for Ewing's sarcoma and primitive neuroectodermal tumor of bone. The New England journal of medicine. 2003;348:694–701. - PubMed
    1. Delattre O, Zucman J, Plougastel B, Desmaze C, Melot T, Peter M, Kovar H, Joubert I, de Jong P, Rouleau G, et al. Gene fusion with an ETS DNA-binding domain caused by chromosome translocation in human tumours. Nature. 1992;359:162–165. - PubMed
    1. Lessnick SL, Dacwag CS, Golub TR. The Ewing's sarcoma oncoprotein EWS/FLI induces a p53-dependent growth arrest in primary human fibroblasts. Cancer cell. 2002;1:393–401. - PubMed
    1. Riggi N, Suva ML, Suva D, Cironi L, Provero P, Tercier S, Joseph JM, Stehle JC, Baumer K, Kindler V, Stamenkovic I. EWS-FLI-1 expression triggers a Ewing's sarcoma initiation program in primary human mesenchymal stem cells. Cancer Research. 2008;68:2176–2185. - PubMed

Publication types

MeSH terms