

doi: 10.1038/ncomms9032.
Piezoresistivity in single DNA molecules
Affiliations
- PMID: 26337293
- PMCID: PMC4569700
- DOI: 10.1038/ncomms9032
Item in Clipboard
Piezoresistivity in single DNA molecules
Nat Commun.
.
Abstract
Piezoresistivity is a fundamental property of materials that has found many device applications. Here we report piezoresistivity in double helical DNA molecules. By studying the dependence of molecular conductance and piezoresistivity of single DNA molecules with different sequences and lengths, and performing molecular orbital calculations, we show that the piezoresistivity of DNA is caused by force-induced changes in the π-π electronic coupling between neighbouring bases, and in the activation energy of hole hopping. We describe the results in terms of thermal activated hopping model together with the ladder-based mechanical model for DNA proposed by de Gennes.
Figures
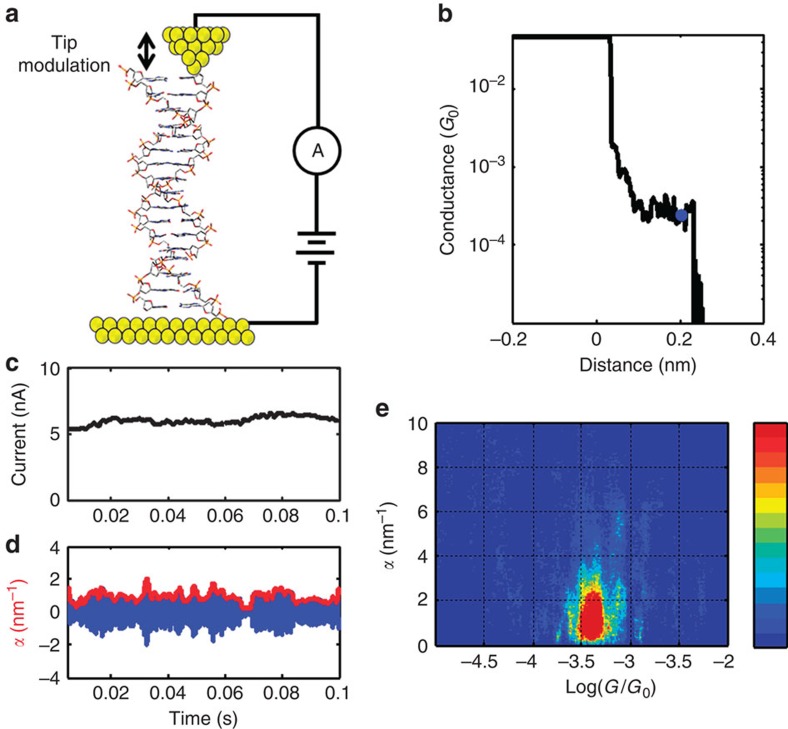
(a) Schematic diagram of STM-BJ with a modulating tip. (b) Conductance versus distance decay curve for a single G–C molecule, where the blue dot marks the position at which the molecular conductance and piezoresistance are measured. (c) Low-frequency component of the current collected from the single double-stranded DNA junction shown in b, which gives the conductance of the molecule. (d) Red curve: amplitude of conductance modulation normalized with conductance, which describes the piezoresistivity in DNA (α). Blue curve: conductance modulation due to tip modulation. (e) α versus conductance histogram for G–C sequence.
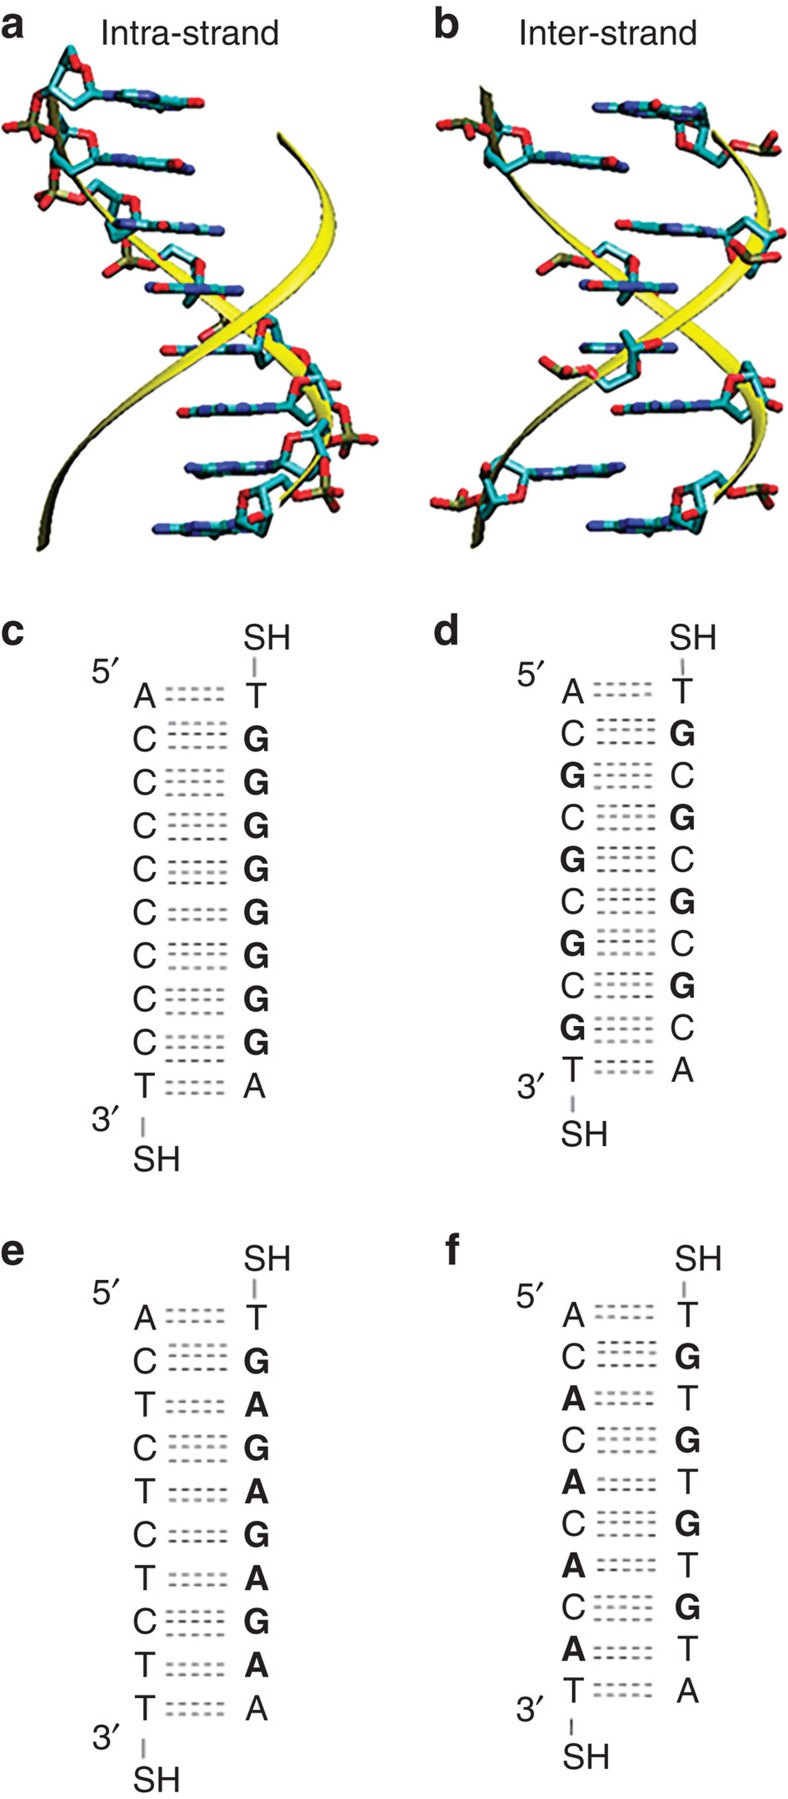
Intra-strand purine (a) and inter-stand purine (b) stacked sequences, illustrating the spatial separation of purine bases. Intra-strand stacked sequences: G–G (c) and G–A (e) and inter-strand stacked sequences: G–C (d) and G–T (f).
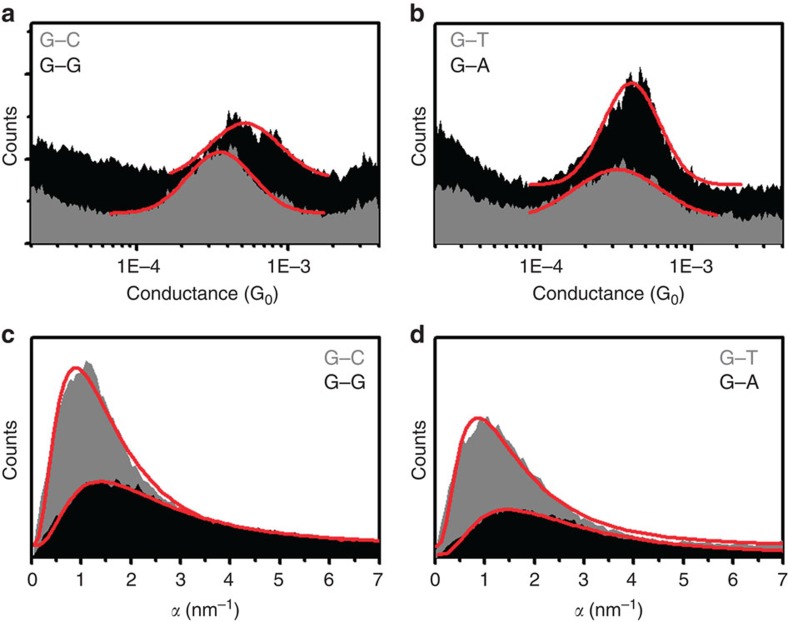
(a) Conductance histograms comparing G–C (grey) with G–G (black). (b) Conductance histograms comparing G–T (grey) with G–A (black). Red lines indicate Gaussian fittings. (c) α histograms comparing G–C (grey) with G–G (black). (d) α histograms comparing G–T (grey) with G–A (black). The peak position for intra-strand purine sequences (G–G and G–A) are larger than for inter-strand purine sequences (G–C and G–T). Red lines indicate log-normal function fitting. Grey conductance histograms are offset for clarity.
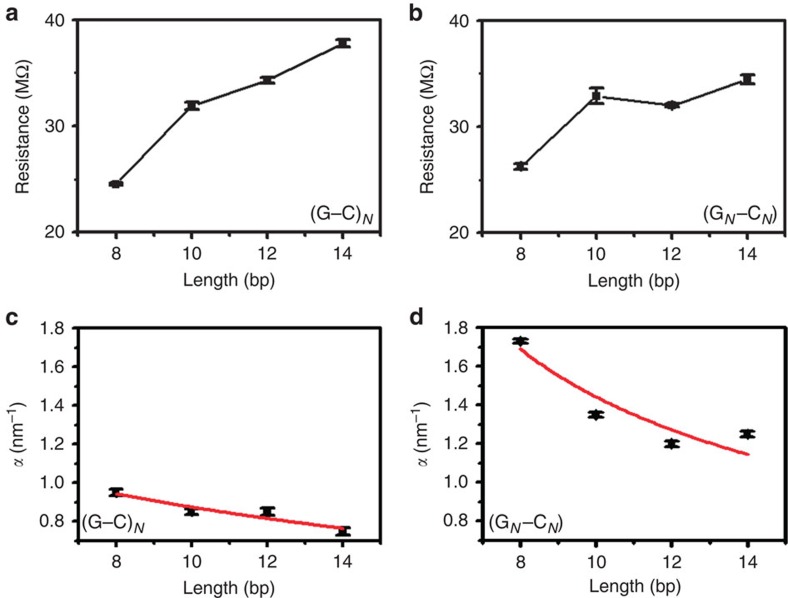
(a,b) Resistance versus molecular length for (G–C)N and (GN–CN) sequences, respectively. Both molecular sequences are approximately linearly (as opposed to exponentially) dependent on molecular length. Note, however, that oscillations in resistance do occur, particularly for the intra-strand purine stacked sequence (GN–CN), see discussion in Supplementary Information. (c,d) α versus molecular length for (G–C)N and (GN–CN) sequences, respectively. Red lines are fitted using the thermally activated hopping model with de Gennes' stretching correction. Note that the intra-strand purine stacked sequence (GN–CN) is larger and more sensitive to molecular length than the inter-strand purine sequence (G–C)N. Error bars represent the fitting error for histograms fit with Gaussian peaks.
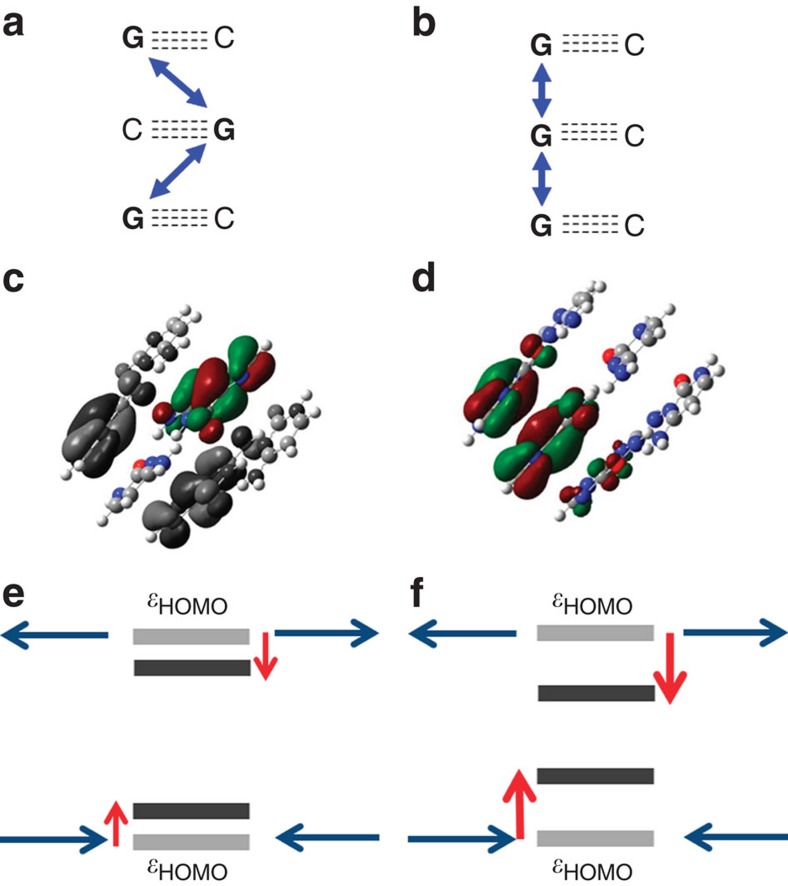
(a,b) 2D layout of base pairs calculated. Arrows indicate coupling between hopping sites. (c,d) Example of CGC and GGG sequence in B-form structure, respectively. The HOMO energy level of the centre base pair, in colour, is calculated. Note that grey scale orbitals in c are degenerate HOMO levels located on outside bases, while all green and red portions in d are the delocalized HOMO of the central base pair. (e,f) Demonstration of the HOMO energy level for the centre base pair increasing and decreasing with modulation. Intra-strand guanine sequence experiences larger amplitude shift in HOMO energy, and ultimately activation energy, with modulation.
References
-
- Xu B., Xiao X. & Tao N. J. Measurements of single-molecule electromechanical properties. J. Am. Chem. Soc. 125, 16164–16165 (2003). - PubMed
-
- Diez-Perez I. et al. Controlling single-molecule conductance through lateral coupling of π orbitals. Nat. Nanotechnol. 6, 226–231 (2011). - PubMed
-
- Bruot C., Hihath J. & Tao N. Mechanically controlled molecular orbital alignment in single molecule junctions. Nat. Nanotechnol. 7, 35–40 (2012). - PubMed
-
- Rascón-Ramos H., Artés J. M., Li Y. & Hihath J. Binding configurations and intramolecular strain in single-molecule devices. Nat. Mater. 14, 1–6 (2015). - PubMed
-
- Rajski S. R., Jackson B. A. & Barton J. K. DNA repair: models for damage and mismatch recognition. Mutat. Res. 447, 49–72 (2000). - PubMed
Publication types
MeSH terms
Substances
LinkOut - more resources
Full Text Sources
Other Literature Sources
Molecular Biology Databases
Research Materials
Miscellaneous
