. 2015 Nov 1;26(21):3867-78.
doi: 10.1091/mbc.E15-06-0442. Epub 2015 Sep 2.

PTP1B-dependent regulation of receptor tyrosine kinase signaling by the actin-binding protein Mena

Affiliations

PTP1B-dependent regulation of receptor tyrosine kinase signaling by the actin-binding protein Mena

Shannon K Hughes et al. Mol Biol Cell. .

Abstract

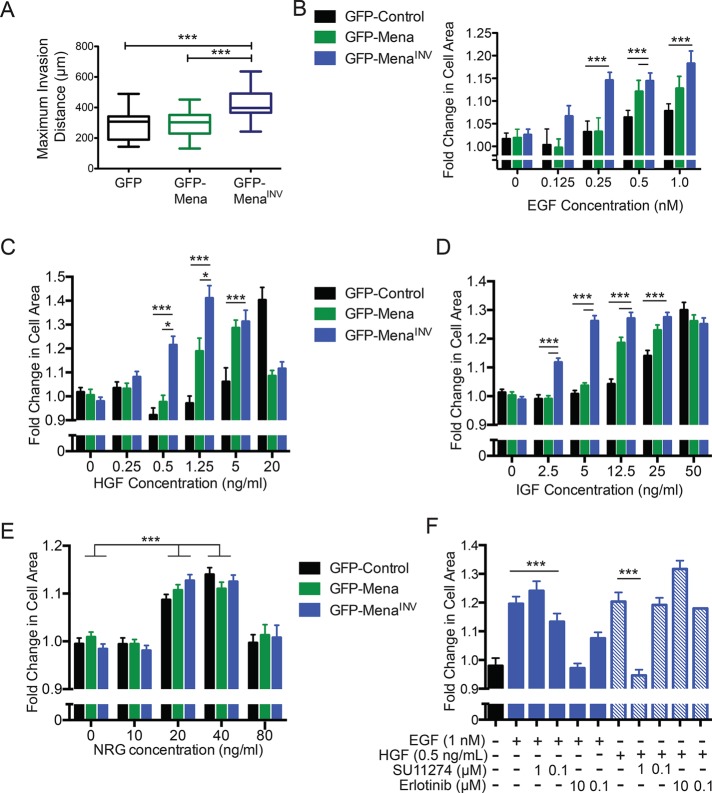
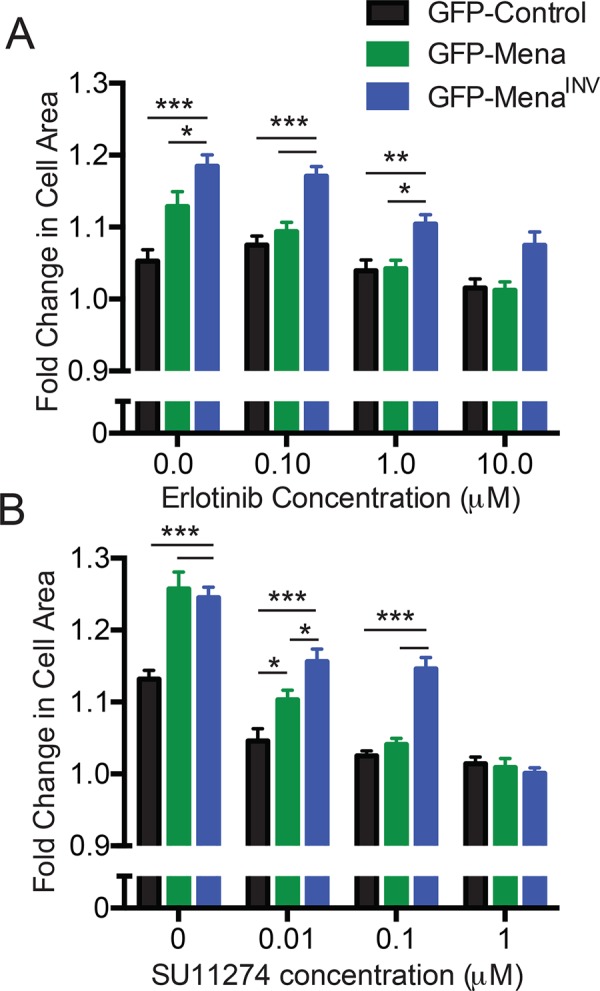
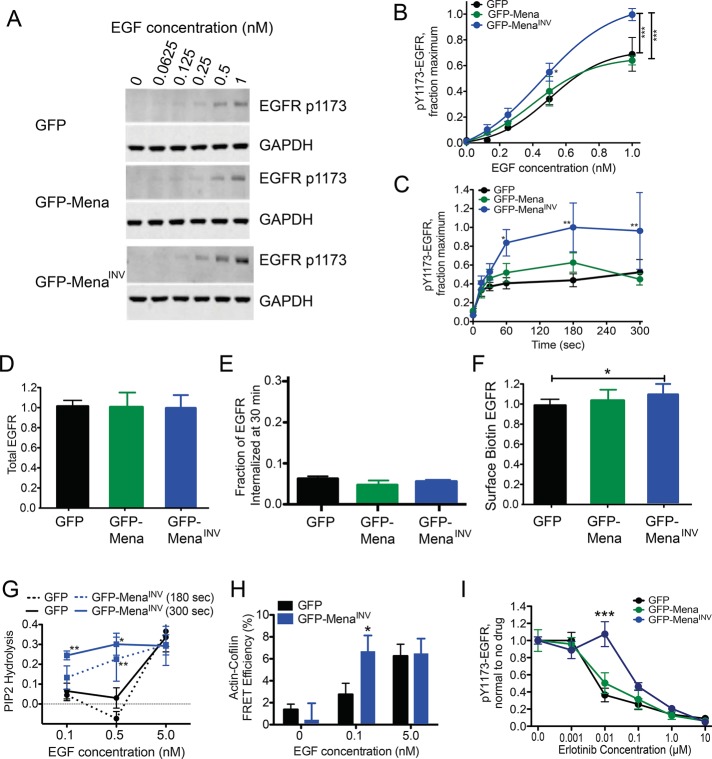
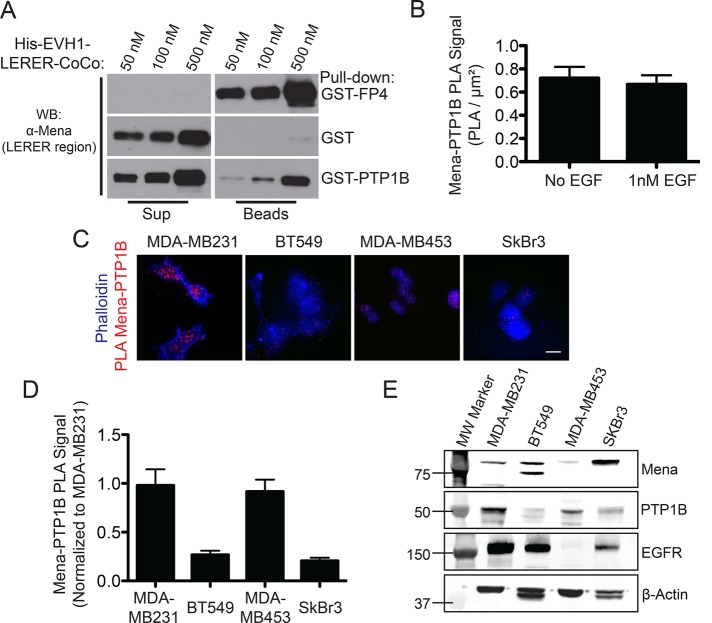
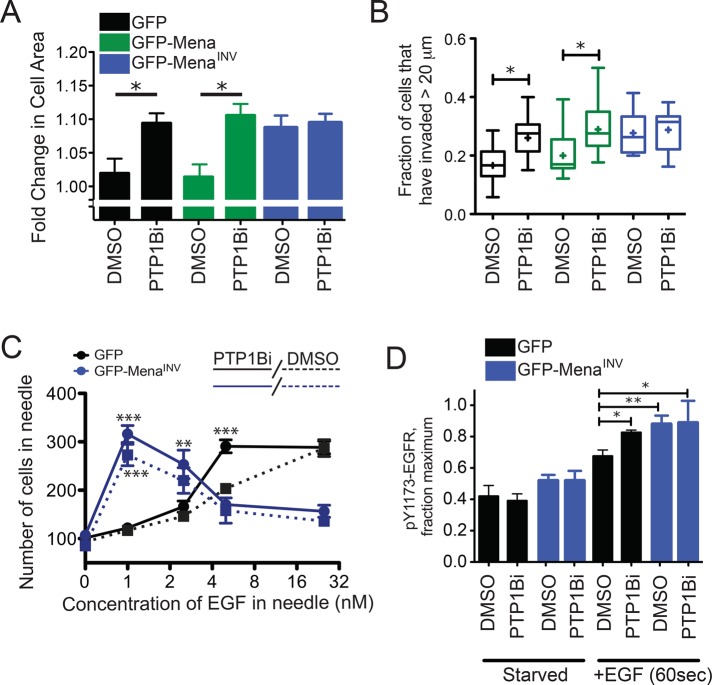
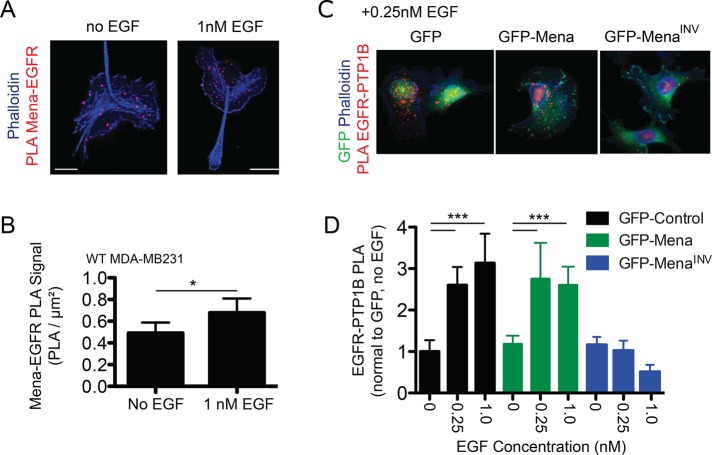
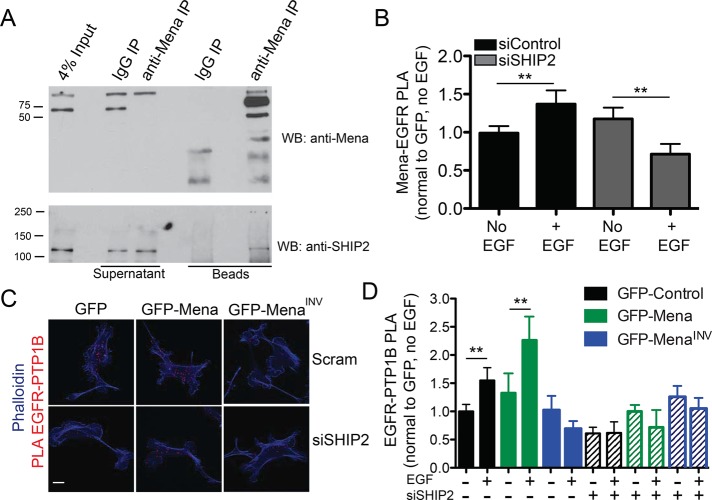
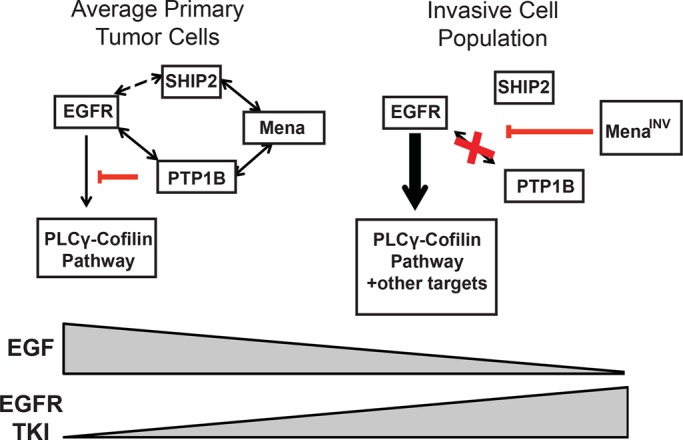
During breast cancer progression, alternative mRNA splicing produces functionally distinct isoforms of Mena, an actin regulator with roles in cell migration and metastasis. Aggressive tumor cell subpopulations express Mena(INV), which promotes tumor cell invasion by potentiating EGF responses. However, the mechanism by which this occurs is unknown. Here we report that Mena associates constitutively with the tyrosine phosphatase PTP1B and mediates a novel negative feedback mechanism that attenuates receptor tyrosine kinase signaling. On EGF stimulation, complexes containing Mena and PTP1B are recruited to the EGFR, causing receptor dephosphorylation and leading to decreased motility responses. Mena also interacts with the 5' inositol phosphatase SHIP2, which is important for the recruitment of the Mena-PTP1B complex to the EGFR. When Mena(INV) is expressed, PTP1B recruitment to the EGFR is impaired, providing a mechanism for growth factor sensitization to EGF, as well as HGF and IGF, and increased resistance to EGFR and Met inhibitors in signaling and motility assays. In sum, we demonstrate that Mena plays an important role in regulating growth factor-induced signaling. Disruption of this attenuation by Mena(INV) sensitizes tumor cells to low-growth factor concentrations, thereby increasing the migration and invasion responses that contribute to aggressive, malignant cell phenotypes.


Figures

FIGURE 1:
FIGURE 1:
MenaINV expression confers sensitivity to select growth factors. (A) Invasion distance into 2 mg/ml collagen gel in full serum medium, using high-throughput 3D collagen invasion Iuvo platform (Bellbrook Labs) of MDA-MB231 cells expressing different Mena isoforms. ***p < 0.001 by nonparametric Kruskal–Wallis test and Dunn’s multiple-comparison test. (B) Dose-response of lamellipodial protrusion in MDA-MB231 cells, reflected by fold change in cell area 8 min after addition of EGF. Results shown as mean ± SEM. Asterisks indicate significant difference by nonparametric Kruskal–Wallis test and Dunn’s multiple-comparison test, with comparisons indicated by lines above; 35–158 cells/condition. (C–E) Dose-response of lamellipodial protrusion in MDA-MB231 cells, reflected by fold change in cell area 8 min after addition of IGF (C), HGF (D), or NRG (E). Results shown as mean ± SEM. Asterisks indicate significant difference by nonparametric Kruskal–Wallis test and Dunn’s multiple-comparison test, with comparisons indicated by lines above; 35–158 cells/condition. (F) Lamellipodial protrusion dose-response 8 min after costimulation with 1 nM EGF or 0.5 ng/ml HGF and SU11274 or erlotinib, respectively. Significance measured by nonparametric Kruskal–Wallis test and Dunn’s multiple-comparison test; *p < 0.05, ***p < 0.001 as indicated. See also Supplemental Figures S1 and S2.
FIGURE 2:
FIGURE 2:
MenaINV expression confers resistance to targeted kinase inhibitors. (A) Lamellipodial protrusion response after stimulation with 1 nM EGF and increasing erlotinib doses. Fold change in cell area calculated 8 min poststimulation. Results shown as mean ± SEM; 16–48 cells/condition. Asterisks indicate significant difference by two-way analysis of variance (ANOVA). (B) Lamellipodial protrusion dose-response after costimulation with 0.5 ng/ml HGF and increasing SU11274. Fold change in cell area calculated 8 min poststimulation. Results shown as shown as mean ± SEM; 39–71 cells/condition. Asterisks indicate significant difference by two-way ANOVA; *p < 0.05, **p < 0.01, and ***p < 0.001 as indicated.
FIGURE 3:
FIGURE 3:
MenaINV expression does not affect EGFR presentation but increases signaling pathway activation at low levels of EGF. (A) Representative Western blot of MDA-MB231 cells expressing GFP, GFP-Mena, or GFP-MenaINV stimulated after bolus stimulation with EGF for 3 min. (B) Quantification of EGFR phosphorylation at Y1173 shown in A by densitometry. Results are mean ± SD; three experiments. Asterisks indicate significant difference by ANOVA with Tukey multiple-comparison test (*p < 0.05 vs. MDA-MB231-GFP cells, ***p < 0.001). (C) Time course of EGFR phosphorylation at Y1173 in response to 0.25 nM EGF. Asterisks indicate significant difference by ANOVA with Tukey multiple-comparison test (*p < 0.05 vs. MDA-MB231-GFP cells at 0.5 nM or **p < 0.01 vs. conditions indicated by bar). (D) Total EGFR protein normalized to GFP control measured by ELISA. n > 10 for each bar in MDA-MB231 cells. Data shown as mean ± SD. (E) Fraction of total EGFR internalized at basal (no EGF) conditions in serum-free medium after 30 min at 37C. Data shown as mean ± range; n = 2. (F) Membrane level of EGFR measured by biotin labeling of surface proteins, EGFR capture ELISA, and detection of protein by HRP-labeled streptavidin in MDA-MB231 cells. Data normalized to GFP control cells in each experiment. Data shown as mean ± SD; n > 10 for each bar. (G) Fraction of PI(4,5)P2 lost from the cell membrane at specified time after EGF stimulation, measured using PLCδ-PH domain FRET assay in MTLn3 cells. *p < 0.05 and **p < 0.01 vs. GFP at respective time point using ANOVA with Tukey posttest. (H) Cofilin activity, reflected by the amount of cofilin bound to actin quantified by an antibody FRET assay 300 s after EGF stimulation in MTLn3 cells. *p < 0.05 vs. GFP at respective EGF concentration using two-tailed t test. (I) EGFR phosphorylation dose-response 3 min poststimulation with 1 nM EGF and increasing erlotinib in MDA-MB231 cells. Data shown as mean ± SEM; ***p < 0.001 vs. MDA-MB231-GFP and GFP-Mena by two-way ANOVA. See Supplemental Figure S3.
FIGURE 4:
FIGURE 4:
Mena interacts with PTP1B. (A) In vitro binding assay using immobilized GST-PTP1B and increasing concentrations of soluble His-Mini-Mena (containing Mena EVH1-LERER domains linked to the C-terminal coiled-coil; bottom lanes). Positive control with GST-FP4 (top lanes) and negative control with glutathione beads + GST alone (middle lanes) included to demonstrate assay specificity. Blots from representative experiment; n = 3. (B) Quantification of PLA for PTP1B and Mena in wild-type MDA-MB231 ± 1 nM EGF for 60 s. Data shown as mean ± SEM. Specificity of assay established using Mena/ mouse embryonic fibroblasts, where background signal was negligible (data not shown). (C) Representative images for PTP1B-Mena PLA in four breast cancer cell lines: MDA-MB231, BT549, MDA-MB453, and SkBr3. (D) Mena-PTP1B PLA across four human breast cancer cell lines compared with signal measured in wild-type MDA-MB231 cells. Data shown as mean PLA/μm2 normalized to MDA-MB231 ± SEM (E) Western blot showing expression of Mena, PTP1B, and EGFR in four human breast cancer cell lines. See Supplemental Figure S4.
FIGURE 5:
FIGURE 5:
Inhibition of PTP1B mimics the effects of MenaINV expression. (A) Lamellipodial protrusion of MDA-MB231 cells 8 min poststimulation with 0.25 nM EGF after incubation with 0.1% DMSO or 10 μM PTP1B inhibitor for 60 min. Results are mean with 95% confidence intervals; 48 cells/condition. Asterisk indicates significant difference by ANOVA with Tukey multiple-comparison test (*p < 0.05). (B) 3D collagen invasion after 24 h in the presence of 0.25 nM EGF and 0.1% DMSO or 10 μM PTP1B inhibitor. Results are represented as box and whiskers at 5 and 95% percentiles; cross indicates mean value; five assays/condition. Asterisk indicates significant difference by nonparametric Kruskal–Wallis test and Dunn’s multiple-comparison test (*p < 0.05). (C) EGF dose-response of invasive cells collected from MTLn3 xenograft tumors expressing GFP (black solid and dotted lines) or GFP-MenaINV (blue solid or dotted lines). Needles contained EGF and 0.01% DMSO without (dotted lines) or with10 μM PTP1B inhibitor (solid lines). Results are mean ± SEM and plotted on log 2 x-axis; more than three tumors for conditions with error bars; one tumor for conditions without error bars. Asterisks indicate significant difference by nonparametric Kruskal–Wallis test and Dunn’s multiple-comparison test (**p < 0.01 or ***p < 0.001) at each concentration of EGF for conditions with more than three tumors. (D) EGFR phosphorylation at Y1173 (0.25 nM EGF, 3 min) after 60 min of preincubation with 0.1% DMSO or 10 μM PTP1B inhibitor after 4 h of serum starvation. Results are mean ± SEM; three experiments. Asterisks indicate significant difference by ANOVA with Student-Newman-Keuls multiple-comparison test (*p < 0.05, **p < 0.01). See also Supplemental Figure S5 and Supplemental Table S6.
FIGURE 6:
FIGURE 6:
PTP1B recruitment to EGFR is abrogated in cells expressing MenaINV. (A) Represen­tative images for Mena-EGFR PLA ± EGF (1 nM, 60 s). Phalloidin shown in blue, and Mena-EGFR PLA shown in red. (B) Quantification of Mena-EGFR PLA in wild-type MDA-MB231 cells ± EGF (1 nM, 60 s). Asterisk indicates significant difference by two-tailed t test (*p < 0.05). (C) Represen­tative images for EGFR-PTP1B PLA for MDA-MB231 cells expressing GFP, GFP-Mena, or GFP-MenaINV stimulated with 0.25 nM EGF for 60 s. GFP signal shown in green, phalloidin shown in blue, and EGFR-PTP1B PLA shown in red. (D) Quantification of EGFR-PTP1B PLA ± 0.25 nM EGF for 60 s. Data are mean with 95% confidence interval; >20 cells/condition. Asterisks indicate significant difference by ANOVA with Tukey multiple-comparison test (***p < 0.001).
FIGURE 7:
FIGURE 7:
A SHIP2-Mena-PTP1B complex regulates EGFR-PTP1B interaction in MDA-MB231 cells. (A) Total Mena protein was immunoprecipitated from Rat2 fibroblast lysate and immunoblotted for SHIP2. (B) Quantification of Mena-EGFR PLA in wild-type MDA-MB231 cells starved or stimulated with 1 nM EGF for 60 s. Experiment performed 72 h posttransfection with 25 nM control (siControl) or SHIP2 (siSHIP2)–targeted SMARTPool siRNA. Results are shown as mean with 95% confidence intervals; >20 cells/condition. Asterisks indicate significant difference by ANOVA with Tukey multiple-comparison test (**p < 0.01). (C) Representative images of EGFR-PTP1B PLA in MDA-MB231 cell lines 72 h posttransfection with siControl or siSHIP2. (D) EGFR-PTP1B PLA in MDA-MB231 cell lines 72 h posttransfection with siControl (indicated by “–“ in siSHIP2 line) or siSHIP2. Cells stimulated ± 0.25 nM EGF for 60 s. Results are shown as mean with 95% confidence intervals; > 50 cells/condition. Asterisks indicate significant difference by nonparametric Kruskal–Wallis test and Dunn’s multiple-comparison test (**p < 0.05). See also Supplemental Figure S7.
FIGURE 8:
FIGURE 8:
Model for Mena-dependent regulation of RTK signaling. In average primary tumor cells, activation of EGFR leads to rapid recruitment of a SHIP2-Mena-PTP1B complex, which leads to receptor dephosphorylation by PTP1B and sensitivity to TKIs. However, in the invasive tumor cell population, where levels of MenaINV are high, SHIP2-dependent recruitment of PTP1B to EGFR is abolished, eliminating PTP1B-mediated dephosphorylation of EGFR, causing sensitivity to EGF, as well as resistance to TKIs.

Similar articles

Cited by

References

    1. Alexander S, Friedl P. Cancer invasion and resistance: interconnected processes of disease progression and therapy failure. Trends Mol Med. 2012;18:13–26. - PubMed
    1. Avraham R, Yarden Y. Feedback regulation of EGFR signalling: decision making by early and delayed loops. Nat Rev Mol Cell Biol. 2011;12:104–117. - PubMed
    1. Bailly M, Wyckoff J, Bouzahzah B, Hammerman R, Sylvestre V, Cammer M, Pestell R, Segall JE. Epidermal growth factor receptor distribution during chemotactic responses. Mol Biol Cell. 2000;11:3873–3883. - PMC - PubMed
    1. Balavenkatraman KK, Aceto N, Britschgi A, Mueller U, Bence KK, Neel BG, Bentires-Alj M. Epithelial protein-tyrosine phosphatase 1B contributes to the induction of mammary tumors by HER2/Neu but is not essential for tumor maintenance. Mol Cancer Res. 2011;9:1377–1384. - PMC - PubMed
    1. Ball LJ, Jarchau T, Oschkinat H, Walter U. EVH1 domains: structure, function and interactions. FEBS Lett. 2002;513:45–52. - PubMed

Publication types

MeSH terms