

The influence of the size and aspect ratio of anisotropic, porous CaCO3 particles on their uptake by cells
- PMID: 26337452
- PMCID: PMC4558630
- DOI: 10.1186/s12951-015-0111-7
The influence of the size and aspect ratio of anisotropic, porous CaCO3 particles on their uptake by cells
Abstract
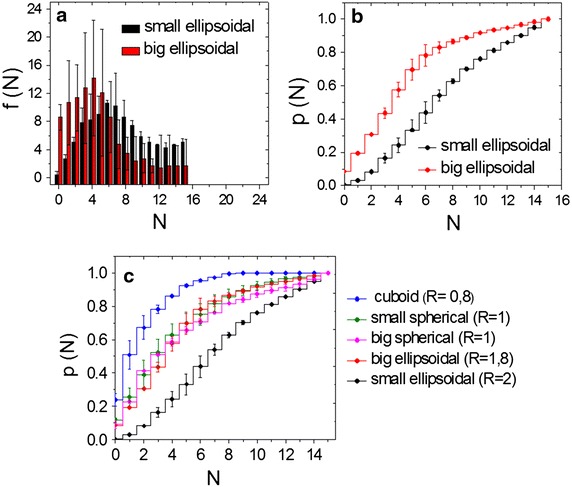
Background: Recent reports highlighting the role of particle geometry have suggested that anisotropy can affect the rate and the pathway of particle uptake by cells. Therefore, we investigate the internalization by cells of porous calcium carbonate particles with different shapes and anisotropies.
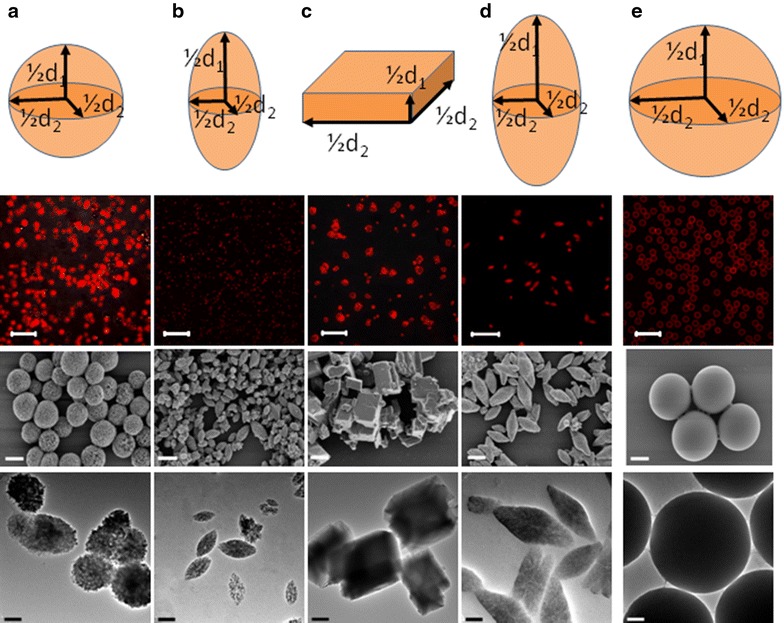
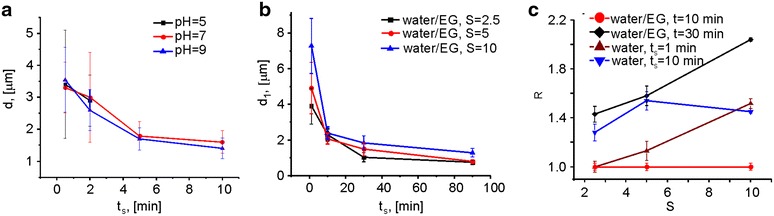
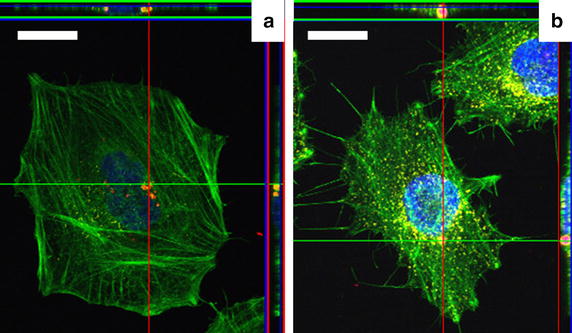
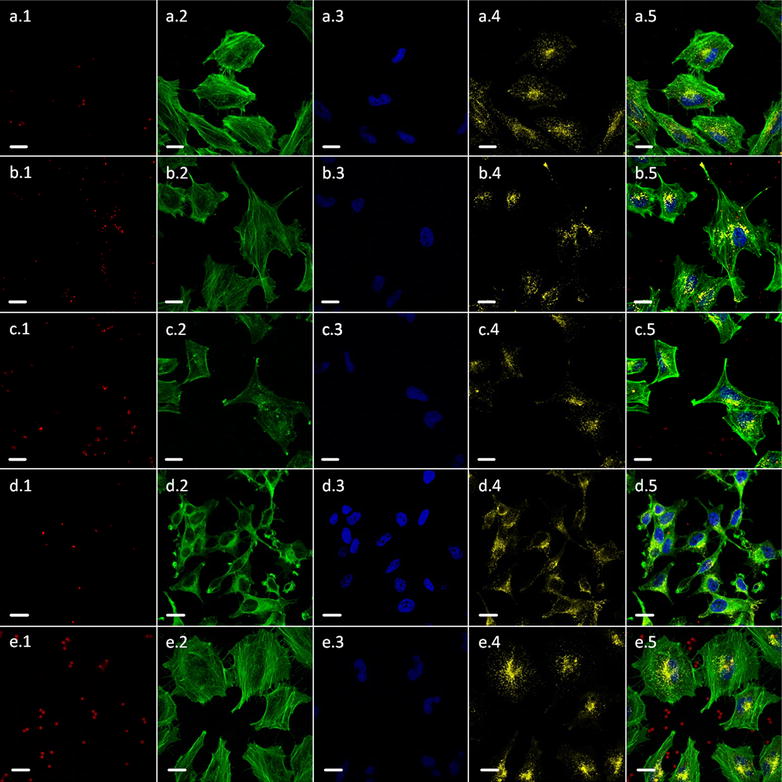
Results: We report here on a new method of the synthesis of polyelectrolyte coated calcium carbonate particles whose geometry was controlled by varying the mixing speed and time, pH value of the reaction solution, and ratio of the interacting salts used for particle formation. Uptake of spherical, cuboidal, ellipsoidal (with two different sizes) polyelectrolyte coated calcium carbonate particles was studied in cervical carcinoma cells. Quantitative data were obtained from the analysis of confocal laser scanning microscopy images.
Conclusions: Our results indicate that the number of internalized calcium carbonate particles depends on the aspect ratio of the particle, whereby elongated particles (higher aspect ratio) are internalized with a higher frequency than more spherical particles (lower aspect ratio). The total volume of internalized particles scales with the volume of the individual particles, in case equal amount of particles were added per cell.
Figures
Similar articles
-
Loading Capacity versus Enzyme Activity in Anisotropic and Spherical Calcium Carbonate Microparticles.ACS Appl Mater Interfaces. 2016 Jun 8;8(22):14284-92. doi: 10.1021/acsami.6b03492. Epub 2016 May 24. ACS Appl Mater Interfaces. 2016. PMID: 27166641
-
Live-Cell Imaging by Confocal Raman and Fluorescence Microscopy Recognizes the Crystal Structure of Calcium Carbonate Particles in HeLa Cells.Biotechnol J. 2018 Nov;13(11):e1800071. doi: 10.1002/biot.201800071. Epub 2018 Jul 10. Biotechnol J. 2018. PMID: 29917328
-
Polyelectrolyte multilayer microcapsules templated on spherical, elliptical and square calcium carbonate particles.J Mater Chem B. 2013 Mar 7;1(9):1223-1228. doi: 10.1039/c2tb00416j. Epub 2013 Jan 21. J Mater Chem B. 2013. PMID: 32260793
-
How shape influences uptake: interactions of anisotropic polymer nanoparticles and human mesenchymal stem cells.Small. 2012 Jul 23;8(14):2222-30. doi: 10.1002/smll.201102002. Epub 2012 Apr 23. Small. 2012. PMID: 22528663
-
Particle morphology: an important factor affecting drug delivery by nanocarriers into solid tumors.Expert Opin Drug Deliv. 2018 Apr;15(4):379-395. doi: 10.1080/17425247.2018.1420051. Epub 2017 Dec 27. Expert Opin Drug Deliv. 2018. PMID: 29264946 Review.
Cited by
-
Complexity of the Nano-Bio Interface and the Tortuous Path of Metal Oxides in Biological Systems.Antioxidants (Basel). 2021 Apr 1;10(4):547. doi: 10.3390/antiox10040547. Antioxidants (Basel). 2021. PMID: 33915992 Free PMC article. Review.
-
Synthesis and functionalization of monodisperse near-ultraviolet and visible excitable multifunctional Eu(3+), Bi(3+):REVO4 nanophosphors for bioimaging and biosensing applications.Nanoscale. 2016 Jun 16;8(24):12221-36. doi: 10.1039/c6nr03369e. Nanoscale. 2016. PMID: 27253384 Free PMC article.
-
Unveiling the nanotoxicological aspects of Se nanomaterials differing in size and morphology.Bioact Mater. 2022 Jun 25;20:489-500. doi: 10.1016/j.bioactmat.2022.06.014. eCollection 2023 Feb. Bioact Mater. 2022. PMID: 35800405 Free PMC article.
-
Elongated Particles Show a Preferential Uptake in Invasive Cancer Cells.Nanomaterials (Basel). 2024 Nov 25;14(23):1891. doi: 10.3390/nano14231891. Nanomaterials (Basel). 2024. PMID: 39683280 Free PMC article.
-
Influence of the chirality of carbon nanodots on their interaction with proteins and cells.Nat Commun. 2021 Dec 10;12(1):7208. doi: 10.1038/s41467-021-27406-1. Nat Commun. 2021. PMID: 34893594 Free PMC article.
References
Publication types
MeSH terms
Substances
LinkOut - more resources
Full Text Sources
Other Literature Sources
