. 2016 Mar;23(3):484-95.
doi: 10.1038/cdd.2015.116. Epub 2015 Sep 4.

Downregulation of microRNA-362-3p and microRNA-329 promotes tumor progression in human breast cancer

Affiliations

Downregulation of microRNA-362-3p and microRNA-329 promotes tumor progression in human breast cancer

H Kang et al. Cell Death Differ. 2016 Mar.

Abstract

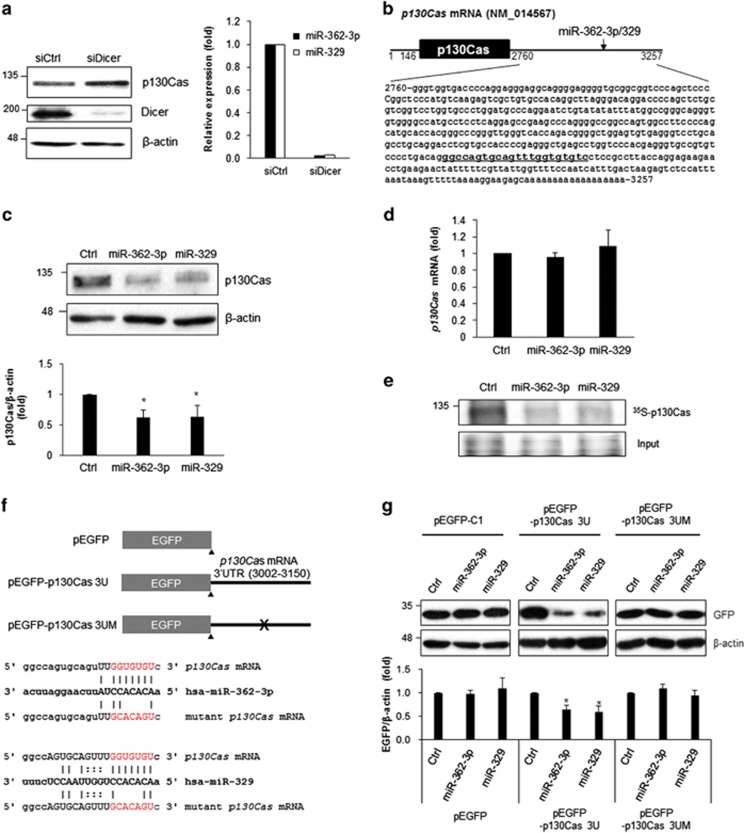
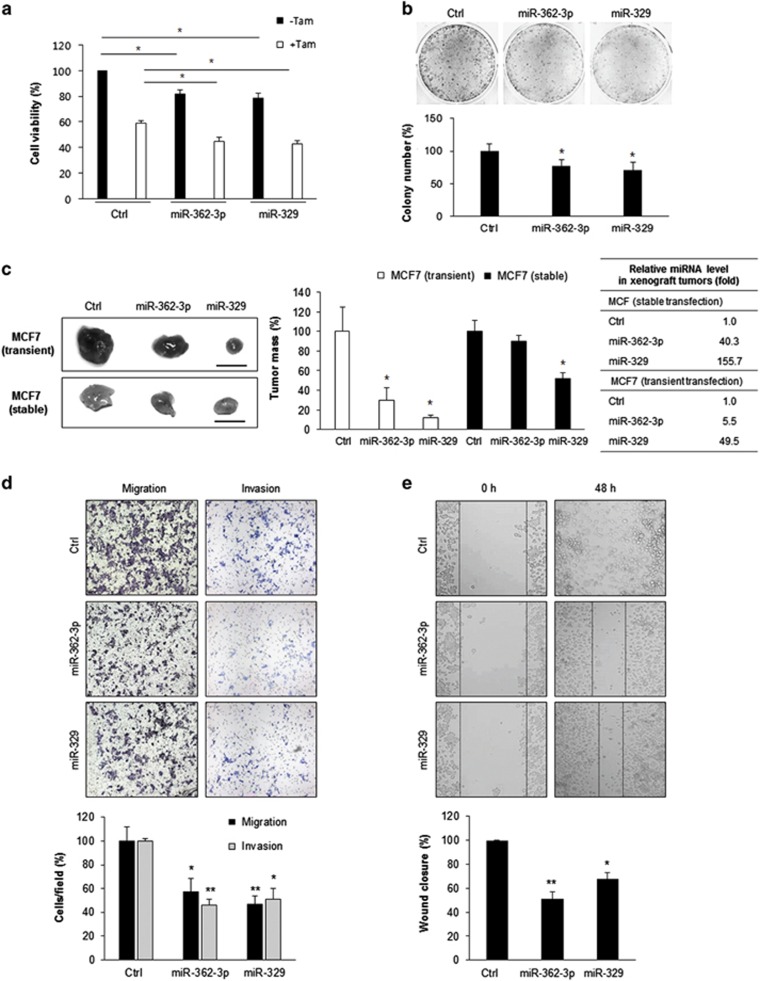
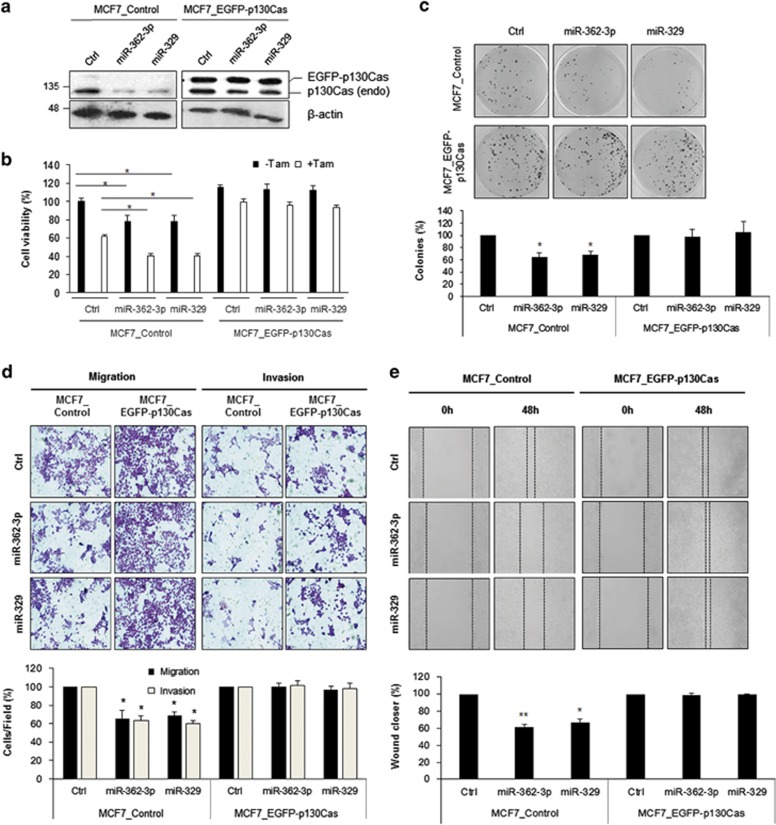
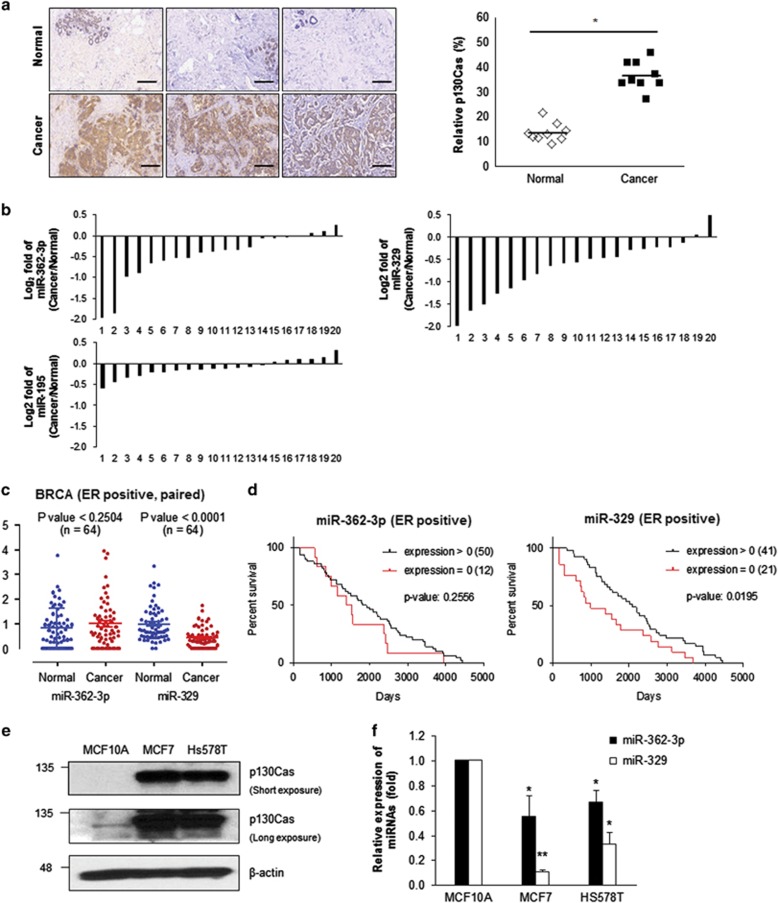
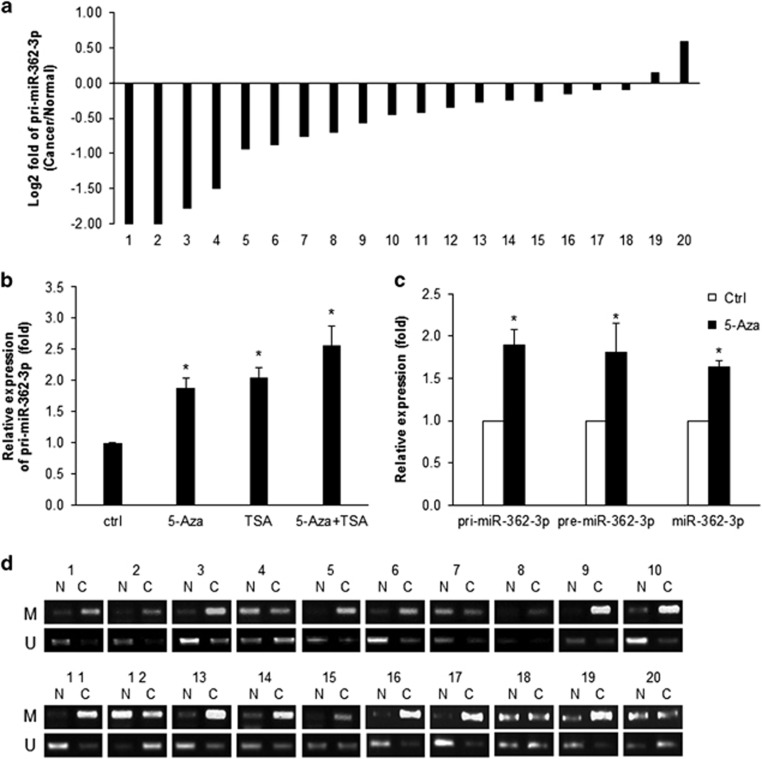
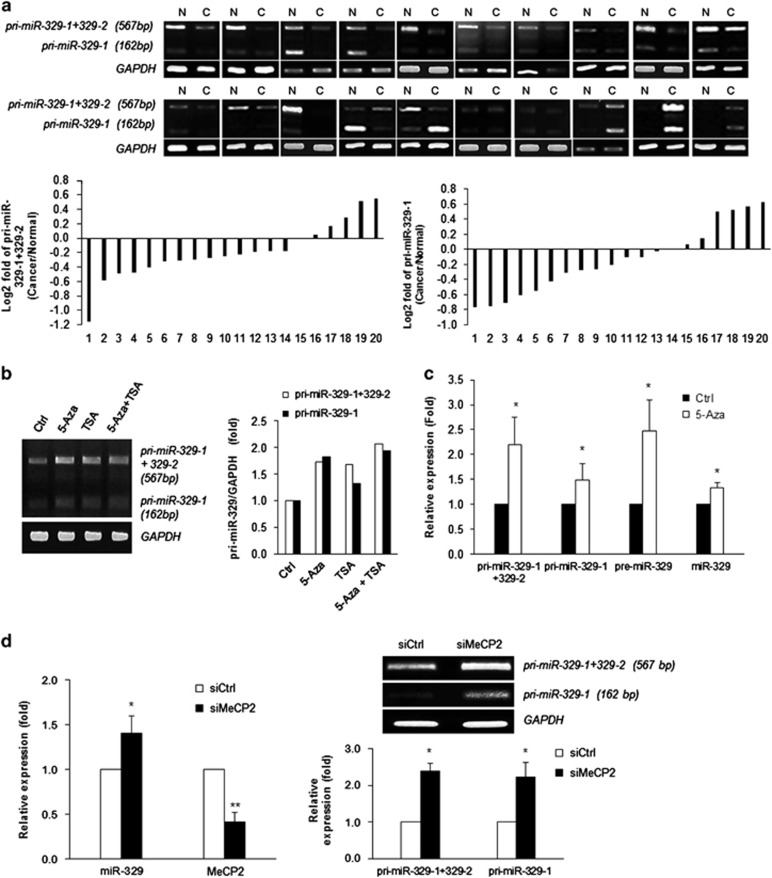
p130Cas regulates cancer progression by driving tyrosine receptor kinase signaling. Tight regulation of p130Cas expression is necessary for survival, apoptosis, and maintenance of cell motility in various cell types. Several studies revealed that transcriptional and post-translational control of p130Cas are important for maintenance of its expression and activity. To explore novel regulatory mechanisms of p130Cas expression, we studied the effect of microRNAs (miRs) on p130Cas expression in human breast cancer MCF7 cells. Here, we provide experimental evidence that miR-362-3p and miR-329 perform a tumor-suppressive function and their expression is downregulated in human breast cancer. miR-362-3p and miR-329 inhibited cellular proliferation, migration, and invasion, thereby suppressing tumor growth, by downregulating p130Cas. Ectopic expression of p130Cas attenuated the inhibitory effects of the two miRs on tumor progression. Relative expression levels of miR-362-3p/329 and p130Cas between normal and breast cancer correlated inversely; miR-362-3p/329 expression was decreased, whereas that of p130Cas increased in breast cancers. Furthermore, we showed that downregulation of miR-362-3p and miR-329 was caused by differential DNA methylation of miR genes. Enhanced DNA methylation (according to methylation-specific PCR) was responsible for downregulation of miR-362-3p and miR-329 in breast cancer. Taken together, these findings point to a novel role for miR-362-3p and miR-329 as tumor suppressors; the miR-362-3p/miR-329-p130Cas axis seemingly has a crucial role in breast cancer progression. Thus, modulation of miR-362-3p/miR-329 may be a novel therapeutic strategy against breast cancer.


Figures

Figure 1
Figure 1
miR-362-3p and miR-329 inhibit p130Cas expression. (a) Relative expression of p130Cas and miR-362-3p/miR-329. Forty-eight hours after transfection of control siRNA (siCtrl) or Dicer siRNA (siDicer) into MCF7 cells, total protein was isolated using RIPA buffer and the relative amount of p130Cas and Dicer were assessed by western blotting (left) or miRNA-362-3p/miR-329 levels were determined by RT-qPCR (right). U6 snRNA was used for normalization. (b) A diagram of p130Cas mRNA. A miR-binding site for miR-362-3p and miR-329 was found in the 3′-untranslated region (3′UTR) of p130Cas mRNA (underlined). (c and d) Regulation of p130Cas expression by miR-362-3p/miR-329. Forty-eight hours after transfection of miR mimics or control miR into MCF7 cells, relative level of p130Cas was determined by western blotting (c) or RT-qPCR (d) β-actin served as a loading control. GAPDH mRNA was used for normalization. (e) Translational regulation of p130Cas by miR-362-3p or miR-329. After incubation of miR-transfected cells with 35S-methionine/cysteine, the radiolabeled p130Cas protein was immunoprecipitated using p130Cas antibody, separated by SDS-PAGE and visualized using PharoseFX Plus. The representative image shows relative levels of nascent p130Cas. (f) A schematic of the EGFP reporter constructs. The 3′UTR of p130Cas mRNA containing a miR-binding site was inserted into pEGFP-C1; a mutant reporter construct lacking the miR-binding site was generated using site-directed mutagenesis. (g) Reporter analysis after miR expression. After transfection of the cells with miRs and reporter constructs along with a proper control vector, EGFP levels were assessed by western blotting. β-Actin served as a loading control. All data are presented as mean±S.D. of three independent experiments (paired t-test); *P<0.05
Figure 2
Figure 2
miR-362-3p and miR-329 inhibit cellular viability, growth, migration, and invasiveness. (a) Cell viability was determined by 3-(4,5-dimethylthiazol-2-yl)-2,5-diphenyltetrazolium bromide (MTT) assay after 48 h transfection of miR mimics with or without tamoxifen treatment in MCF7 cells. (b) Colony formation assay. After transfection of miR mimics in MCF7 cells, 1 × 10³ cells were seeded and cultured for 3 weeks. Colonies were stained with crystal violet and the number of colonies was analyzed. (c) Xenograft tumor growth assay. miR-362-3p/329 or control miR were expressed into MCF7 cells by transient or stable transfection. 2 × 10⁶ cells were subcutaneously injected into the flank of male BALB/c nude mice and xenograft tumor mass was analyzed 4 weeks later. Relative miR expression in the xenograft tumors was assessed by RT-qPCR and fold changes were shown in the table. Scale bar, 1 cm. (d) Migration and invasion assays. MCF7 cells transfected with miR mimics or control miR were seed Boyden chamber and migrating or invading cells were stained and counted in three randomly selected visual fields. (e) Wound-healing assays. MCF7 cells transfected with miR mimics or control miR were cultured until confluence, and a scratch was made in the cell layer. After 48 h, relative wound closure was quantified as the ratio of the migration distance to control distance. The data are presented either as mean±S.D. or as a representative graph/image from three independent experiments (paired t-test); *P<0.05, **P<0.01
Figure 3
Figure 3
miR-362-3p and miR-329 regulate cell viability, growth, cell migration, and invasiveness via p130Cas. (a) Relative expression of p130Cas with or without miR-362-3p/329 in stable cell lines. Forty-eight hours after transfection of miR mimics or control miRs, relative expressions of p130Cas were determined by western blotting. (b) Cell viability was determined by MTT assay after 48 h transfection of miRs mimics with or without tamoxifen treatment in both MCF7_Control cells and MCF7_EGFP-130Cas cells. (c) Colony formation assay. MCF7_Control and MCF7_EGFP-p130Cas cells were transfected with miR mimics or control miR and 103 cells were cultured for 3 weeks, and colonies were stained with crystal violet and counted in three randomly selected visual fields. (d) Migration and invasion assays. MCF7_Control and MCF7_EGFP-p130Cas cells transfected with miR mimics or control miR were seed Boyden chamber and migrating or invading cells were stained and counted in three randomly selected visual fields. (e) Wound-healing assay. MCF7_Control and MCF7_EGFP-p130Cas cells were transfected with miR mimics or control miR and grown until confluence. A scratch was made in the cell layer, and relative wound closure was quantified as the ratio of the migration distance to control distance after 48 h. The data are presented as either mean±S.D. or a representative graph/image from three independent experiments (paired t-test); *P<0.05
Figure 4
Figure 4
Expression of miR-362-3p or miR-329 inversely correlates with p130Cas levels in human breast cancers. (a) Relative expression levels of p130Cas according to immunohistochemical analysis involving an anti-p130Cas antibody. The representative images from nine pairs of breast cancer samples with the corresponding normal tissues. Scale bar, 100 μm. (b) Relative expression levels of miRs among tissues. The log2 value of three different miRs fold change in 20 paired breast cancer specimen. (c) The expressions of miRs in ER-positive breast cancer patients. The quantities of miR-362-3p and miR-329 were plotted using the vertical scatter plots. Bars represent mean expression with standard errors. (d) The relation between survival and miRs expression. 62 patients who have a termination event were divided into two groups: patients expressing miR-362-3p or miR-329 and patients with no miR-362-3p or miR-329. The survival analysis was performed using Kaplan and Meier estimate. (e and f) Relative expression levels of p130Cas and miR-362-3p/329 in human breast MCF10A, MCF7, and Hs578T cells. p130Cas levels were determined by western blotting using p130Cas antibody (e) and miR-362-3p/329 levels were assessed by RT-qPCR (f). The data are presented as mean±S.D. of three independent experiments (paired t-test); *P<0.05, **P<0.01
Figure 5
Figure 5
Expression of miR-362-3p is regulated via DNA methylation. (a) Relative expression level of primary transcript (pri-miR-362-3p). The log2 value of pri-miR-362-3p fold change in 20 paired breast cancer specimen. (b) Relative expression levels of pri-miR-362-3p after 5-aza-2′-deoxycytidine (5-Aza) and/or Trichostatin A (TSA) treatment. MCF7 cells were incubated with 2.5 μM 5-Aza for 72 h and/or with 100ng/ml TSA for 12 h. After isolation of total RNA, the expression level of pri-miR-362-3p was assessed using RT-qPCR. GAPDH mRNA was used for normalization. (c) Relative expression levels of pri-miR-362-3p, pre-miR-362-3p, and muature miR-362-3p after 5-Aza treatment were assessed by RT-qPCR. GAPDH mRNA or U6 snRNA were used for normalization of pri-/pre-miR and mature miR, respectively. (d) Methylation-specific PCR (MSP). Genomic DNA was isolated from each sample and was incubated with bisulfite for 2.5 h. The differential status of CpG islands in the promoter region of CLCN5, the host gene of miR-362-3p, was assessed by means of MSP with specific primer sets shown in Table 1. The data are presented as mean±S.D. of three independent experiments (paired t-test); *P<0.05
Figure 6
Figure 6
Expression of miR-329 is regulated by MeCP2. (a) Relative expression levels of primary transcript (pri-miR-329) in a subset of breast specimens. Total RNA was isolated from breast cancer samples or the corresponding normal tissues, and relative expression levels of pri-miR-329 were assessed using conventional RT-PCR. Pri-miR-329 (pri-miR-329-1 (162 bp) and pri-miR-329-1+pri-miR-329-2 (567 bp)) was detected as two conspicuous bands using the primer sets shown in Table 1. The log2 value shows pri-miR-329 relative fold change in 20 paired human breast specimens. (b) Relative expression level of pri-miR-329 after 5-aza-2′-deoxycytidine (5-Aza) and/or Trichostatin A (TSA) treatment were determined by RT-PCR. (c) Relative expression levels of pri-miR-329, pre-miR-329, and mature miR-329 after 5-Aza treatment were determined by RT-qPCR or RT-PCR. GAPDH mRNA or U6 snRNA were used for normalization of pri-/pre-miR and mature miR, respectively. (d) Relative expression levels of miR-329 after MeCP2 silencing. Forty-eight hours after transfection of MeCP2 siRNA or control siRNA into MCF7 cells, pri-miR-329 level was analyzed by RT-PCR. The data are presented as mean±S.D. of three independent experiments (paired t-test); *P<0.05

Similar articles

Cited by

References

    1. Bouton AH, Riggins RB, Bruce-Staskal PJ. Functions of the adapter protein Cas: signal convergence and the determination of cellular responses. Oncogene 2001; 20: 6448–6458. - PubMed
    1. Defilippi P, Di Stefano P, Cabodi S. p130Cas: a versatile scaffold in signaling networks. Trends Cell Biol 2006; 16: 257–263. - PubMed
    1. van der Flier S, van der Kwast TH, Claassen CJ, Timmermans M, Brinkman A, Henzen-Logmans SC et al. Immunohistochemical study of the BCAR1/p130Cas protein in non-malignant and malignant human breast tissue. Int J Biol Markers 2001; 16: 172–178. - PubMed
    1. Ta HQ, Thomas KS, Schrecengost RS, Bouton AH. A novel association between p130Cas and resistance to the chemotherapeutic drug adriamycin in human breast cancer cells. Cancer Res 2008; 68: 8796–8804. - PMC - PubMed
    1. Barrett A, Pellet-Many C, Zachary IC, Evans IM, Frankel P. p130Cas: a key signalling node in health and disease. Cell Signal 2013; 25: 766–777. - PubMed

Publication types

MeSH terms