

Monitoring changes in malaria epidemiology and effectiveness of interventions in Ethiopia and Uganda: Beyond Garki Project baseline survey
- PMID: 26337671
- PMCID: PMC4559172
- DOI: 10.1186/s12936-015-0852-7
Monitoring changes in malaria epidemiology and effectiveness of interventions in Ethiopia and Uganda: Beyond Garki Project baseline survey
Erratum in
-
Correction to: Monitoring changes in malaria epidemiology and effectiveness of interventions in Ethiopia and Uganda: Beyond Garki Project baseline survey.Malar J. 2019 Nov 25;18(1):373. doi: 10.1186/s12936-019-3006-5. Malar J. 2019. PMID: 31767013 Free PMC article.
Abstract
Background: Scale-up of malaria interventions seems to have contributed to a decline in the disease but other factors may also have had some role. Understanding changes in transmission and determinant factors will help to adapt control strategies accordingly.
Methods: Four sites in Ethiopia and Uganda were set up to monitor epidemiological changes and effectiveness of interventions over time. Here, results of a survey during the peak transmission season of 2012 are reported, which will be used as baseline for subsequent surveys and may support adaptation of control strategies. Data on malariometric and entomological variables, socio-economic status (SES) and control coverage were collected.
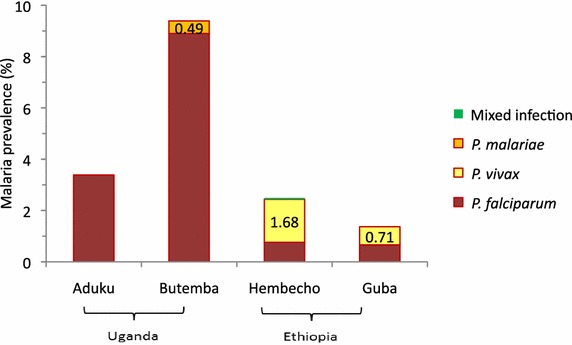
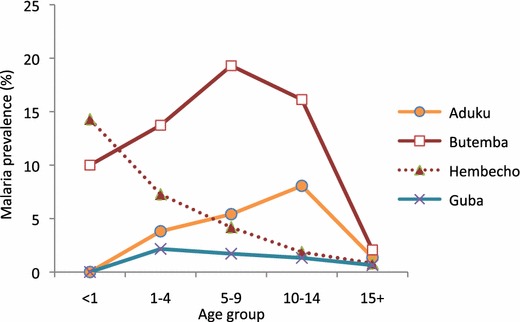
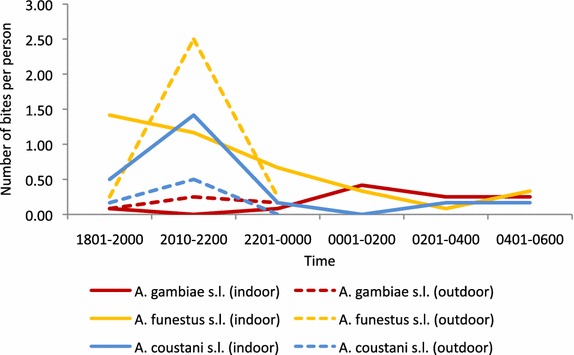
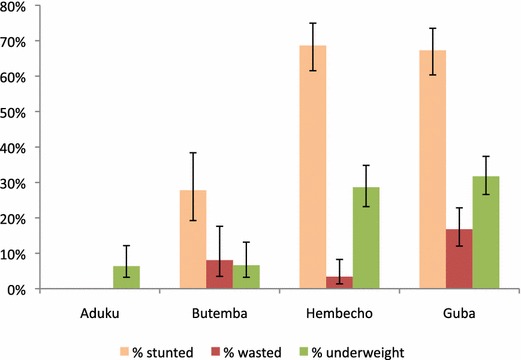
Results: Malaria prevalence varied from 1.4 % in Guba (Ethiopia) to 9.9 % in Butemba (Uganda). The most dominant species was Plasmodium vivax in Ethiopia and Plasmodium falciparum in Uganda. The majority of human-vector contact occurred indoors in Uganda, ranging from 83 % (Anopheles funestus sensu lato) to 93 % (Anopheles gambiae s.l.), which is an important factor for the effectiveness of insecticide-treated nets (ITNs) or indoor residual spraying (IRS). High kdr-L1014S (resistance genotype) frequency was observed in A. gambiae sensu stricto in Uganda. Too few mosquitoes were collected in Ethiopia, so it was not possible to assess vector habits and insecticide resistance levels. ITN ownership did not vary by SES and 56-98 % and 68-78 % of households owned at least one ITN in Ethiopia and Uganda, respectively. In Uganda, 7 % of nets were purchased by households, but the nets were untreated. In three of the four sites, 69-76 % of people with access to ITNs used them. IRS coverage ranged from 84 to 96 % in the three sprayed sites. Half of febrile children in Uganda and three-quarters in Ethiopia for whom treatment was sought received diagnostic tests. High levels of child undernutrition were detected in both countries carrying important implications on child development. In Uganda, 7-8 % of pregnant women took the recommended minimum three doses of intermittent preventive treatment.
Conclusion: Malaria epidemiology seems to be changing compared to earlier published data, and it is essential to have more data to understand how much of the changes are attributable to interventions and other factors. Regular monitoring will help to better interpret changes, identify determinants, modify strategies and improve targeting to address transmission heterogeneity.
Figures
References
-
- WHO . World malaria report 2014. Geneva: World Health Organization; 2014.
Publication types
MeSH terms
Substances
LinkOut - more resources
Full Text Sources
Other Literature Sources
Medical
