. 2015 Sep 4:5:13605.
doi: 10.1038/srep13605.

Hypoxia-induced carbonic anhydrase IX facilitates lactate flux in human breast cancer cells by non-catalytic function

Affiliations

Hypoxia-induced carbonic anhydrase IX facilitates lactate flux in human breast cancer cells by non-catalytic function

Somayeh Jamali et al. Sci Rep. .

Abstract

The most aggressive tumour cells, which often reside in hypoxic environments, rely on glycolysis for energy production. Thereby they release vast amounts of lactate and protons via monocarboxylate transporters (MCTs), which exacerbates extracellular acidification and supports the formation of a hostile environment. We have studied the mechanisms of regulated lactate transport in MCF-7 human breast cancer cells. Under hypoxia, expression of MCT1 and MCT4 remained unchanged, while expression of carbonic anhydrase IX (CAIX) was greatly enhanced. Our results show that CAIX augments MCT1 transport activity by a non-catalytic interaction. Mutation studies in Xenopus oocytes indicate that CAIX, via its intramolecular H(+)-shuttle His200, functions as a "proton-collecting/distributing antenna" to facilitate rapid lactate flux via MCT1. Knockdown of CAIX significantly reduced proliferation of cancer cells, suggesting that rapid efflux of lactate and H(+), as enhanced by CAIX, contributes to cancer cell survival under hypoxic conditions.


Figures

Figure 1
Figure 1. Lactate flux in MCF-7 cancer cells is augmented under hypoxic conditions.
(a) Relative change in intracellular lactate concentration in MCF-7 cells under normoxic (21% O2, black trace) and hypoxic (1% O2, blue trace) conditions, respectively, as induced by application of 1 and 3 mM lactate, measured with Laconic. (b) Rate of change in intracellular lactate concentration in MCF-7 cells under normoxic (21% O2) and hypoxic (1% O2) conditions, respectively, as induced by application of 1 and 3 mM lactate. Hypoxia induces a significant increase in lactate flux. (c) Change in intracellular pH (pHi) in MCF-7 cells under normoxic (21% O2, black trace) and hypoxic (1% O2, blue trace) conditions, respectively, as induced by application of 3 and 10 mM lactate in the absence and presence of the MCT1 inhibitor AR-C155858. (d) Rate of change in pHi in MCF-7 cells under normoxic (21% O2) and hypoxic (1% O2) conditions, respectively, as induced by application and removal, of 3 and 10 mM lactate, respectively. Rate of lactate-induced proton flux is augmented under hypoxic conditions. AR-C155858 fully inhibits proton flux. Data are represented as mean ± SEM.
Figure 2
Figure 2. Expression of CAIX but not of MCT1 and MCT4 is upregulated under hypoxic conditions.
(a) Determination of the Km value for lactate in MCF-7 cells under normoxic (21% O2, grey) and hypoxic (1% O2, blue) conditions, respectively, as determined by the rate of change in pHi during application of 0.3, 1, 3, 10 and 30 mM lactate. Western blots of lysate from MCF-7 cells, incubated under normoxic (21% O2) and hypoxic (1% O2) conditions, labelled for MCT1 (b), MCT2 (c) and MCT4 (d), respectively. For positive control of MCT2, lysate from MCT2-expressing oocytes was used. Actin was used as loading control. (e) Relative change in the RNA level of MCT1 and MCT4 in MCF-7 cells after three days under hypoxic conditions. (f) Relative change in the RNA level of NHE1 and NBCn1 in MCF-7 cells after three days under hypoxic conditions. (g) Relative change in the RNA level of CAII and CAIX in MCF-7 cells after three days under hypoxic conditions. Expression level of CAIX is strongly upregulated, while the expression levels of MCT1, MCT4, NHE1 and NBCe1 show no significant changes. (h) Western blot of MCF-7 cell lysate, labelled for CAIX and actin as loading control. (i) Quantification of CAIX protein level by western blot analysis in MCF-7 cells under normoxic (21% O2) and hypoxic (1% O2) conditions, respectively. (j) Western blots of lysate from MCF-7 cells, incubated under normoxic (21% O2) and hypoxic (1% O2) conditions, labelled for NHE1 and actin. Data are represented as mean ± SEM.
Figure 3
Figure 3. Knockdown of CAIX decreases lactate transport in cancer cells.
(a) Antibody staining for CAIX (green) in MCF-7 cells, kept under hypoxic conditions. Hypoxic cells either remained untreated (a1), mock-transfected with non-targeting negative control siRNA (a2) or transfected with siRNA against CAIX (a3). Nuclei are stained with Hoechst (blue). (b) Quantification of the fluorescent signal for CAIX as shown in (a). (c) Original recording of the relative change in intracellular lactate concentration in MCF-7 cells kept under hypoxic conditions during application of 1 and 3 mM lactate. Cells were either untreated (black trace), mock-transfected with non-targeting negative control siRNA (green trace) or transfected with siRNA against CAIX (blue trace). (d) Rate of change in lactate level during application of 1 and 3 mM lactate in hypoxic MCF-7 cells, either untreated (gray bars), mock-transfected with non-targeting negative control siRNA (green bars) or transfected with siRNA against CAIX (blue bars). Knock-down of CAIX induced a significant decrease in lactate flux. (e) Original recordings of changes in pHi in hypoxic MCF-7 cells, either untreated (control, gray traces), mock-transfected with non-targeting negative control siRNA (green traces) or transfected with siRNA against CAIX (blue traces). (f,g) Rate of change in pHi, as induced by application (f) and removal (g) of lactate, respectively. (h) Original recordings of the relative change in intracellular lactate concentration in MCF-7 cells kept under normoxic (blue traces) or hypoxic (red traces) conditions during application of lactate in the presence and absence of 5% CO2/15 mM HCO3 and 30 μM EZA, respectively. (i) Rate of change in intracellular lactate concentration in MCF-7 cells under normoxic and hypoxic conditions, respectively, as induced by application of 1 mM lactate in the absence and presence of 5% CO2/15 mM HCO3 and 30 μM EZA, respectively. Hypoxia induces a significant increase in lactate flux both in the absence and in the presence of CO2/HCO3 and EZA. Knockdown of CAIX induced a significant decrease in the rate of change in pHi, both during addition and removal of lactate. Data are represented as mean ± SEM.
Figure 4
Figure 4. CAIX enhances MCT transport activity by facilitating its intramolecular H+ shuttle.
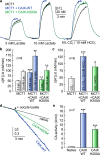
(a) Original recordings of intracellular H+-concentration ([H+]i) in Xenopus oocytes expressing MCT1 (black trace), MCT1+CAIX-WT (blue trace), or MCT1+CAIX-H200A (green trace), respectively, during application of 3 and 10 mM lactate and of 5% CO2/10 mM HCO3. (b,c) Rate of rise in [H+]i, as induced by application of lactate (b) or 5% CO2/10 mM HCO3 (c) in oocytes expressing MCT1, MCT1+CAIX-WT and MCT1+CAIX-H200A, respectively. (d) Original recordings of the log enrichment of 20 native oocytes and 20 oocytes expressing either CAIX-WT or CAIX-H200A. The beginning of the traces shows the rate of degradation of the 18O-labeled substrate in the non-catalysed reaction. The black arrowhead indicates addition of oocytes. (e) Enzymatic activity of native oocytes and oocytes expressing either CAIX-WT or CAIX-H200A. One unit is defined as 100% stimulation of the non-catalysed 18O depletion of doubly labelled 13C18O2. Data are represented as mean ± SEM.
Figure 5
Figure 5. Glycolysis and lactate production are augmented under hypoxic conditions.
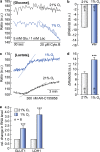
(a) Relative change in intracellular glucose concentration in MCF-7 cells under normoxia (21% O2, black trace) and hypoxia (1% O2, blue trace), respectively, before and during inhibition of glucose uptake with 20 μM Cytochalasin B. (b) Rate of fall in intracellular glucose concentration, after inhibition of glucose uptake with Cytochalasin B in MCF-7 cells under normoxia (21% O2, light grey bar) and hypoxia (1% O2, blue bar), respectively. Hypoxia leads to a significant increase in glycolytic activity, as indicated by the increased rate of fall in glucose. (c) Relative change in intracellular lactate concentration in MCF-7 cells under normoxia (21% O2, black trace) and hypoxia (1% O2, blue trace), respectively, during inhibition of lactate efflux via MCT1 with 300 nm AR-C155858. (d) Rate of change in intracellular lactate concentration, after inhibition of lactate transport in MCF-7 cells under normoxia (21% O2, light grey bar) and hypoxia (1% O2, blue bar), respectively. Hypoxia leads to a robust increase in the rate of lactate production. (e) Relative change in the RNA level of GLUT1 and LDH1 in MCF-7 cells after three days under hypoxic conditions. Data are represented as mean ± SEM.
Figure 6
Figure 6. Knockdown of CAIX decreases cell proliferation.
(a) Staining of nuclei with Hoechst (blue) in MCF-7 cells after 3 days in culture. Hypoxic cells remained either untreated (a1), mock-transfected with non-targeting negative control siRNA (a2), transfected with siRNA against CAIX (a3), incubated with the CA inhibitor EZA (a4), or incubated with the MCT1 inhibitor AR-C155858 (a5). (b) Total number of nuclei/mm2 in MCF-7 cell cultures, kept for 0–3 days under the conditions as described in (a). For every data point four dishes of cells were used and five pictures were taken from each dish at random locations, yielding 20 pictures/data point (n = 20/4). (c) Staining of dead MCF-7 cells with propidium iodide (red) after 3 days in culture. Living cells are visualised by phase contrast. Hypoxic cells remained either untreated (c1), mock-transfected with non-targeting negative control siRNA (c2), transfected with siRNA against CAIX (c3), incubated with the CA inhibitor EZA (c4), or incubated with the MCT1 inhibitor AR-C155858 (c5). As positive control, apoptosis was induced by application of staurosporine (c6). (d) Total number of living (grey) and dead (red) cells/mm2, kept for 3 days under the conditions as described in (c). For every data point 4 dishes of cells from two independent batches were used and 15 pictures were taken from each dish at random locations, yielding 60 pictures/data point (n =6 0/4). Data are represented as mean ± SEM.
Figure 7
Figure 7. Schematic model of the CAIX-mediated increase in lactate transport in cancer cells under hypoxic conditions.
Under normoxic conditions (upper scheme), cancer cells rely on glycolysis and oxidative energy production in the tricarboxylic acid cycle (TCA) to meet their metabolic requirements. Under hypoxic conditions, glycolysis becomes the prime energy source, which leads to vast production of lactate (produced from pyruvate by lactate dehydrogenase, LDH) and H+. Under these conditions (lower left scheme), hypoxia-regulated CAIX, which is directly bound to the complex of MCT and its chaperon CD147, could move protons between the transporter pore and extracellular protonatable residues (light brown circles). Thereby CAIX can function as a ‘H+-distributing antenna’ for the MCT to facilitate rapid extrusion of lactate and H+ from the cell. Knockdown of CAIX (lower right scheme) leads to loss of the ‘H+-distributing antenna’, which decreases MCT transport activity, leading to accumulation of lactate and H+ in the cytosol. A detailed description of the mechanism is given in the Discussion section.

Similar articles

Cited by

References

    1. Hanahan D. & Weinberg R. A. Hallmarks of cancer: the next generation. Cell 144, 646–674 (2011). - PubMed
    1. Schulze A. & Harris A. L. How cancer metabolism is tuned for proliferation and vulnerable to disruption. Nature 491, 364–373 (2012). - PubMed
    1. Parks S. K., Chiche J. & Pouysségur J. Disrupting proton dynamics and energy metabolism for cancer therapy. Nat. Rev. Cancer 13, 611–623 (2013). - PubMed
    1. Brahimi-Horn M. C., Bellot G. & Pouysségur J. Hypoxia and energetic tumour metabolism. Curr. Opin. Genet. Dev . 21, 67–72 (2011). - PubMed
    1. Gatenby R. A. & Gillies R. J. Why do cancers have high aerobic glycolysis? Nat. Rev. Cancer 4, 891–899 (2004). - PubMed

Publication types