

Multiparametric imaging of patient and tumour heterogeneity in non-small-cell lung cancer: quantification of tumour hypoxia, metabolism and perfusion
- PMID: 26338178
- PMCID: PMC4700090
- DOI: 10.1007/s00259-015-3169-4
Multiparametric imaging of patient and tumour heterogeneity in non-small-cell lung cancer: quantification of tumour hypoxia, metabolism and perfusion
Abstract
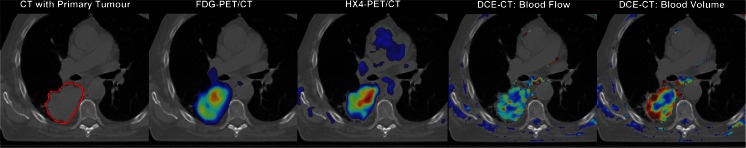
Purpose: Multiple imaging techniques are nowadays available for clinical in-vivo visualization of tumour biology. FDG PET/CT identifies increased tumour metabolism, hypoxia PET visualizes tumour oxygenation and dynamic contrast-enhanced (DCE) CT characterizes vasculature and morphology. We explored the relationships among these biological features in patients with non-small-cell lung cancer (NSCLC) at both the patient level and the tumour subvolume level.
Methods: A group of 14 NSCLC patients from two ongoing clinical trials (NCT01024829 and NCT01210378) were scanned using FDG PET/CT, HX4 PET/CT and DCE CT prior to chemoradiotherapy. Standardized uptake values (SUV) in the primary tumour were calculated for the FDG and hypoxia HX4 PET/CT scans. For hypoxia imaging, the hypoxic volume, fraction and tumour-to-blood ratio (TBR) were also defined. Blood flow and blood volume were obtained from DCE CT imaging. A tumour subvolume analysis was used to quantify the spatial overlap between subvolumes.
Results: At the patient level, negative correlations were observed between blood flow and the hypoxia parameters (TBR >1.2): hypoxic volume (-0.65, p = 0.014), hypoxic fraction (-0.60, p = 0.025) and TBR (-0.56, p = 0.042). At the tumour subvolume level, hypoxic and metabolically active subvolumes showed an overlap of 53 ± 36 %. Overlap between hypoxic sub-volumes and those with high blood flow and blood volume was smaller: 15 ± 17 % and 28 ± 28 %, respectively. Half of the patients showed a spatial mismatch (overlap <5 %) between increased blood flow and hypoxia.
Conclusion: The biological imaging features defined in NSCLC tumours showed large interpatient and intratumour variability. There was overlap between hypoxic and metabolically active subvolumes in the majority of tumours, there was spatial mismatch between regions with high blood flow and those with increased hypoxia.
Keywords: DCE CT; FDG PET; HX4; Hypoxia PET; Image analysis; Multiparametric.
Figures


References
-
- Lambin P, Petit SF, Aerts HJ, van Elmpt WJ, Oberije CJ, Starmans MH, et al. The ESTRO Breur Lecture 2009. From population to voxel-based radiotherapy: exploiting intra-tumour and intra-organ heterogeneity for advanced treatment of non-small cell lung cancer. Radiother Oncol. 2010;96:145–152. doi: 10.1016/j.radonc.2010.07.001. - DOI - PubMed
Publication types
MeSH terms
Substances
Associated data
LinkOut - more resources
Full Text Sources
Other Literature Sources
Medical
