. 2015 Sep 2;35(35):12137-51.
doi: 10.1523/JNEUROSCI.0705-15.2015.

Neuronal-Targeted TFEB Accelerates Lysosomal Degradation of APP, Reducing Aβ Generation and Amyloid Plaque Pathogenesis

Affiliations

Neuronal-Targeted TFEB Accelerates Lysosomal Degradation of APP, Reducing Aβ Generation and Amyloid Plaque Pathogenesis

Qingli Xiao et al. J Neurosci. .

Abstract

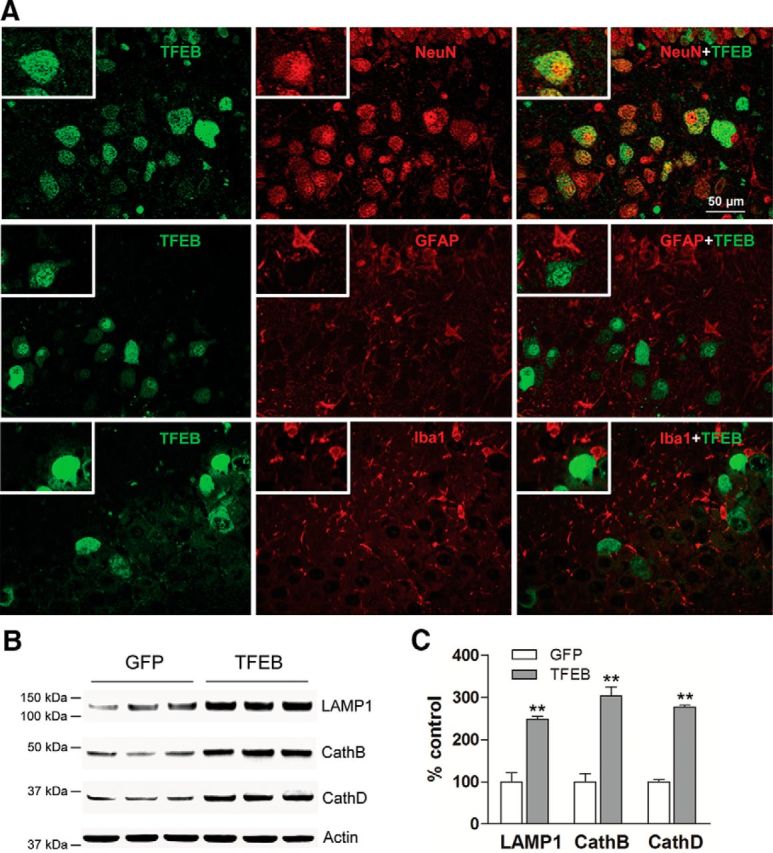
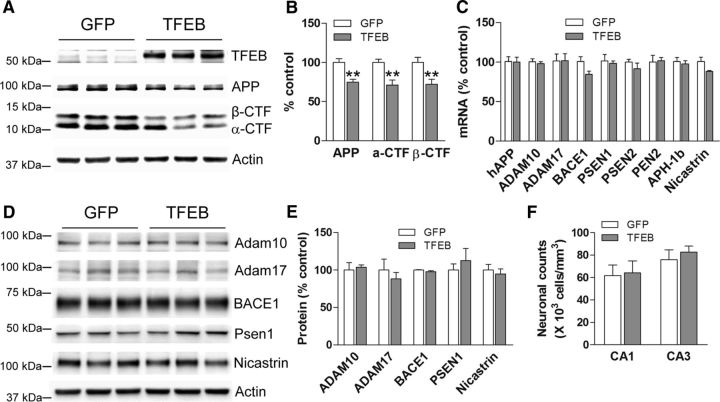
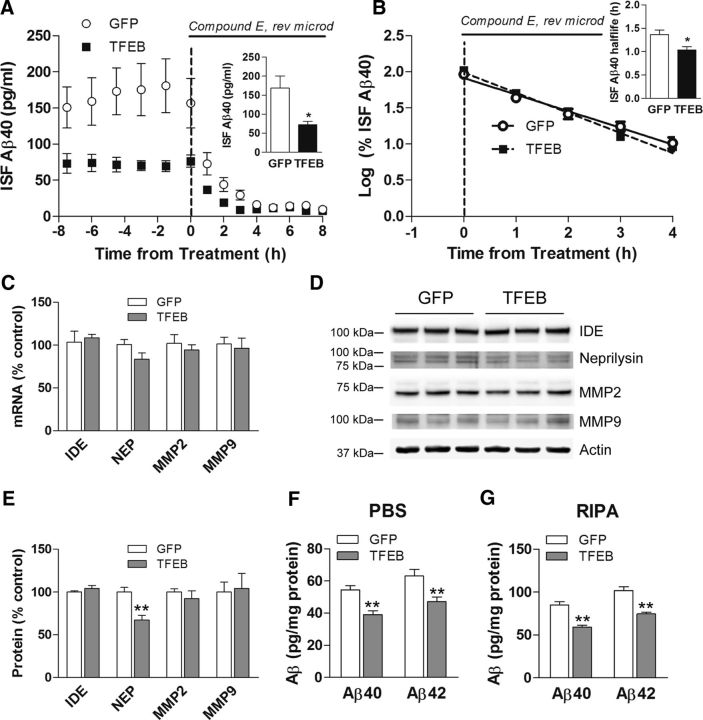
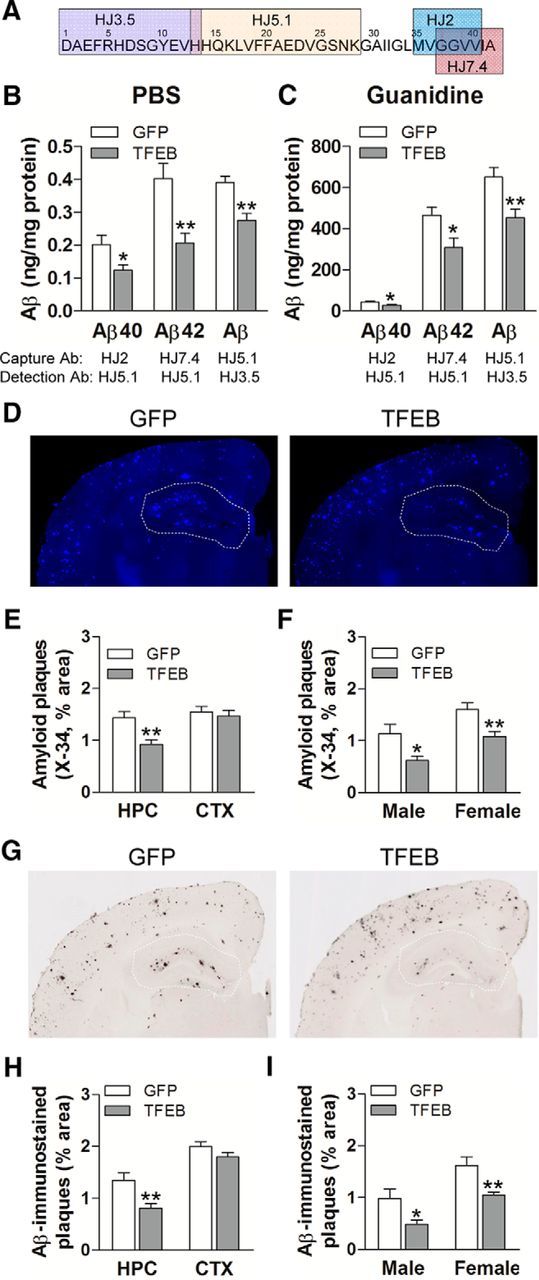
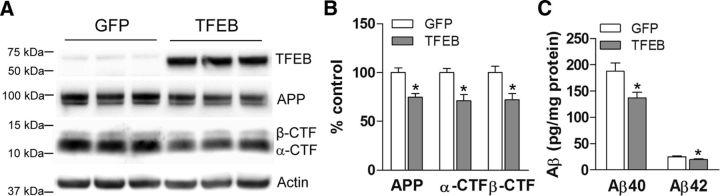
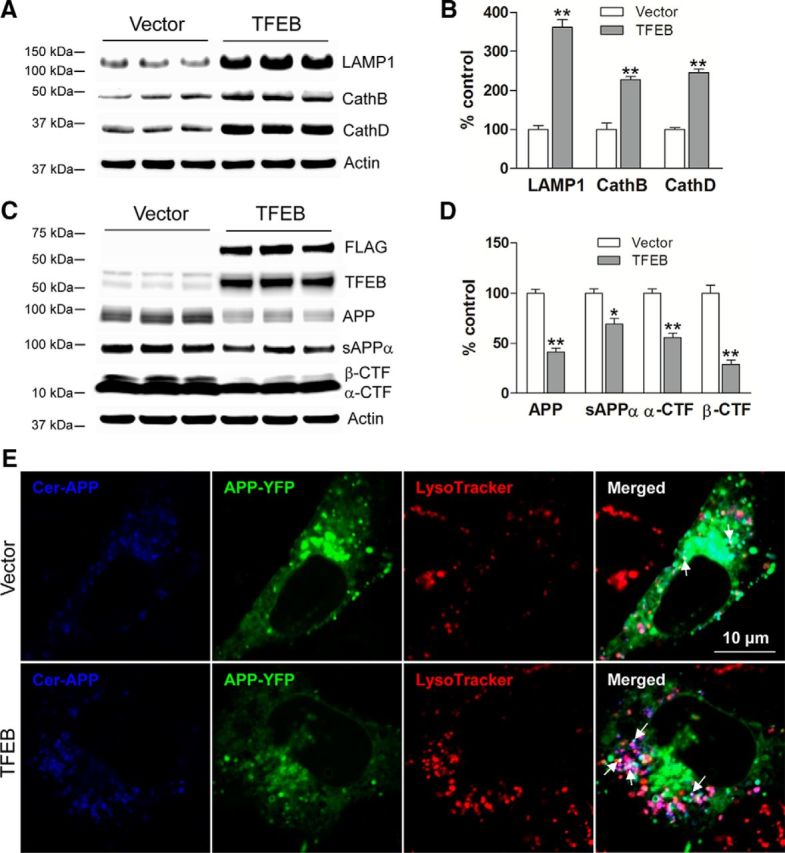
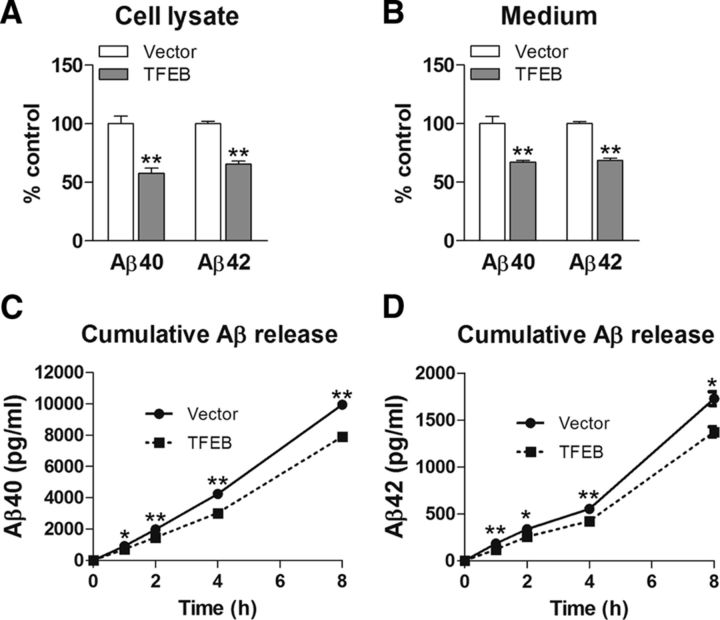
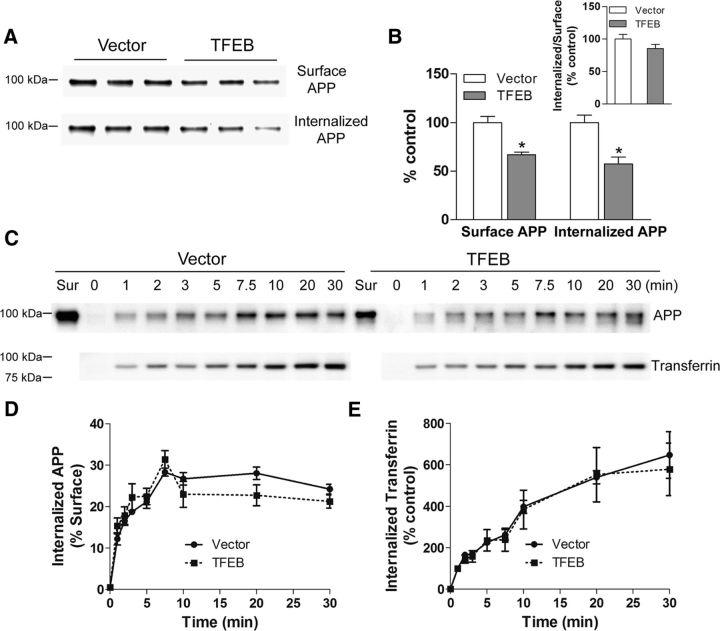
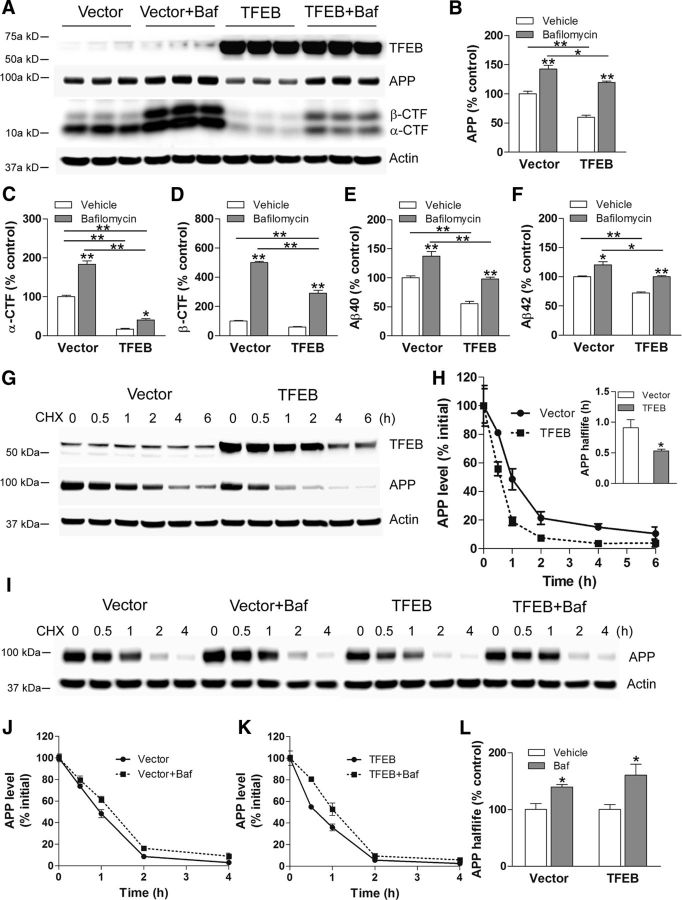
In AD, an imbalance between Aβ production and removal drives elevated brain Aβ levels and eventual amyloid plaque deposition. APP undergoes nonamyloidogenic processing via α-cleavage at the plasma membrane, amyloidogenic β- and γ-cleavage within endosomes to generate Aβ, or lysosomal degradation in neurons. Considering multiple reports implicating impaired lysosome function as a driver of increased amyloidogenic processing of APP, we explored the efficacy of targeting transcription factor EB (TFEB), a master regulator of lysosomal pathways, to reduce Aβ levels. CMV promoter-driven TFEB, transduced via stereotactic hippocampal injections of adeno-associated virus particles in APP/PS1 mice, localized primarily to neuronal nuclei and upregulated lysosome biogenesis. This resulted in reduction of APP protein, the α and β C-terminal APP fragments (CTFs), and in the steady-state Aβ levels in the brain interstitial fluid. In aged mice, total Aβ levels and amyloid plaque load were selectively reduced in the TFEB-transduced hippocampi. TFEB transfection in N2a cells stably expressing APP695, stimulated lysosome biogenesis, reduced steady-state levels of APP and α- and β-CTFs, and attenuated Aβ generation by accelerating flux through the endosome-lysosome pathway. Cycloheximide chase assays revealed a shortening of APP half-life with exogenous TFEB expression, which was prevented by concomitant inhibition of lysosomal acidification. These data indicate that TFEB enhances flux through lysosomal degradative pathways to induce APP degradation and reduce Aβ generation. Activation of TFEB in neurons is an effective strategy to attenuate Aβ generation and attenuate amyloid plaque deposition in AD.

Significance statement: A key driver for AD pathogenesis is the net balance between production and clearance of Aβ, the major component of amyloid plaques. Here we demonstrate that lysosomal degradation of holo-APP influences Aβ production by limiting the availability of APP for amyloidogenic processing. Using viral gene transfer of transcription factor EB (TFEB), a master regulator of lysosome biogenesis in neurons of APP/PS1 mice, steady-state levels of APP were reduced, resulting in decreased interstitial fluid Aβ levels and attenuated amyloid deposits. These effects were caused by accelerated lysosomal degradation of endocytosed APP, reflected by reduced APP half-life and steady-state levels in TFEB-expressing cells, with resultant decrease in Aβ production and release. Additional studies are needed to explore the therapeutic potential of this approach.

Keywords: Alzheimer's disease; TFEB; amyloid; amyloid precursor protein; lysosome.


Figures

Figure 1.
Figure 1.
AAV8-CMV-TFEB drives lysosome biogenesis in neurons. A, Representative confocal images demonstrating expression of TFEB (green) in various CNS cell types marked by the expression of NeuN (neurons; red, top), GFAP (astrocytes; red, middle), and Iba-1 (microglia; red, bottom) in the hippocampus of APP/PS1 mice injected with AAV8-CMV-FLAG-TFEB particles. The boxed inserts (upper left corners) demonstrate magnified images of TFEB-expressing cells. B, C, Immunoblots (B) with quantification (C) of lysosomal proteins in extracts from hippocampi transduced with AAV8-CMV-FLAG-TFEB (TFEB) or AAV8-CMV-GFP (GFP). N = 3 per group; **p < 0.01.
Figure 2.
Figure 2.
Neuronal TFEB transduction results in reduced APP abundance. A, B, Immunoblot (A) with quantitation (B) of APP and its α- and β-CTFs in APP/PS1 mouse hippocampi transduced with AAV8-CMV-FLAG-TFEB (TFEB) or AAV8-CMV-GFP (GFP). N = 6 per group (n = 3 males and n = 3 females); **p < 0.01. Representative immunoblot is from male mouse tissues. C, Expression of transcripts coding for various components of the APP-processing machinery in hippocampal tissues transduced with AAV8-CMV-FLAG-TFEB (TFEB) or AAV8-CMV-GFP (GFP). N = 5 per group. No statistically significant differences were noted for any of the transcripts. D, E, Immunoblot (D) and quantitation (E) of APP-processing machinery proteins in hippocampi transduced with TFEB (or GFP as control, as in A). N = 3 per group. F, Neuronal counts in the CA1 and CA3 layers of the hippocampi from AAV8-CMV-FLAG-TFEB (TFEB) and AAV8-CMV-GFP (GFP)-transduced APP/PS1 mice. N = 4 per group.
Figure 3.
Figure 3.
Neuronal TFEB transduction reduces ISF Aβ levels, in vivo. A, Assessment of Aβ levels by in vivo microdialysis in 3-month-old APP/PS1 mice transduced with AAV8-CMV-FLAG-TFEB (TFEB) and AAV8-CMV-GFP (GFP) with serial hourly measurements. N = 8 mice in TFEB group, n = 9 mice in GFP group. At t = 0, mice were continually administered Compound E directly to the hippocampus (200 nm, reverse microdialysis) followed by hourly sampling for Aβ. Inset shows mean absolute in vivo “exchangeable” Aβ (eAβx-40) concentration averaged over a 9 h period before drug administration; *p < 0.05. B, Semilog plot of decline in percentage basal ISF Aβ levels during administration of Compound E in animals in A. Inset shows Aβ half-life in the two groups; *p < 0.05. C–E, Transcript levels (C) and protein abundance [immunoblot (D) with quantitation (E)] for enzymes implicated in extracellular Aβ metabolism in hippocampal tissue from AAV8-CMV-FLAG-TFEB (TFEB) and AAV8-CMV-GFP (GFP)-transduced APP/PS1 mice. N = 5 per group; **p < 0.01.F, G, Aβ40 and Aβ42 levels in dissected hippocampal tissues from AAV8-CMV-FLAG-TFEB (TFEB) and AAV8-CMV-GFP (GFP)-transduced APP/PS1 mice at 3 months of age. Tissue was homogenized first in PBS (D) then in RIPA (E) quantified with ELISA assay. HJ2 and HJ7.4 antibodies were used for capture Aβ40 and Aβ42, respectively, and HJ5.1 antibody was used for detection. N = 6 mice per group; **p < 0.01.
Figure 4.
Figure 4.
Neuronal TFEB transduction reduces amyloid plaque load in APP/PS1 mice. A, Schematic representation of specific antibodies used in ELISA. B, C, Aβ40 and Aβ42 levels in dissected hippocampal tissues from AAV8-CMV-FLAG-TFEB (TFEB) and AAV8-CMV-GFP (GFP)-transduced mice (10 months of age). Tissue was homogenized first in PBS (soluble levels, B), then in 5 mm guanidine (insoluble levels, C) quantified with ELISA assay. HJ2 and HJ7.4 antibodies were used for capture Aβ40 and Aβ42, respectively, and HJ5.1 antibody was used for detection. Total Aβ levels were also measured with a combination of HJ5.1 antibody for capture and HJ3.5 antibody for detection, as indicated in the schematic. N = 8 mice per group; *p < 0.05, **p < 0.01. D, Representative X-34-stained images from APP/PS1 mice treated as in A. The area of the hippocampus is outlined with a dotted line. E, F, Quantification of X-34-stained plaque burden in the hippocampus (HPC) in mice treated as in A (E) and plaque burden stratified by sex (F). N = 14 (6 male and 8 female) mice per group;*p < 0.05, **p < 0.01. G, Representative Aβ-immunostained images from mice treated as in B. H, I, Quantification of Aβ-stained plaque burden in the hippocampus in mice treated as in A (H) and plaque burden stratified by sex (I). N = 14 (6 male and 8 female) mice per group; *p < 0.05, **p < 0.01. HPC, Hippocampus; CTX, cortex.
Figure 5.
Figure 5.
Neuronal TFEB transduction reduces levels of APP, its CTFs, and Aβ species in wild-type mice. A, B, Immunoblot (A) with quantitation (B) of APP, and its α- and β-CTFs in wild-type mouse hippocampi transduced with AAV8-CMV-FLAG-TFEB (TFEB) or AAV8-CMV-GFP (GFP) at 8 months of age. N = 3 per group; *p < 0.05. C, Aβ40 and Aβ42 levels in dissected hippocampal tissues homogenized in RIPA buffer, from mice transduced as in A. HJ2 and HJ7.4 antibodies were used for capture Aβ40 and Aβ42, respectively, and HJ5.1 antibody was used for detection. N = 6 per group; *p < 0.05.
Figure 6.
Figure 6.
TFEB expression increases lysosomes and reduces levels of APP and its cleaved CTFs, in vitro. A, B, Immunoblots (A) with quantification (B) of lysosomal proteins in N2a-APP695 cells transfected with TFEB or vector control (for 48 h). C, D, Immunoblot (C) with quantitation (D) of APP and its α- and β-CTFs and of sAPPα fragment in the overlying medium, collected over a duration of 6 h in cells treated as in A. N = 3 per group; *p < 0.05, **p < 0.01. E, N2a cells were transfected with a dual fluorescent APP construct (Sannerud et al., 2011) with or without the TFEB construct and stained with LysoTracker Red. As shown in these confocal images, colocalization of full-length APP (both blue and green tags) with LysoTracker Red-labeled lysosomes (see arrows) was qualitatively increased in TFEB-expressing cells (see arrows) compared with empty vector-expressing cells.
Figure 7.
Figure 7.
TFEB expression attenuates Aβ generation, in vitro. A, B, Abundance of Aβ40 and Aβ42 species in the cell lysates (A) and medium (B) in N2a-APP695 cells transfected with TFEB or vector control. C, D, Accumulation of Aβ40 (C) and Aβ42 (D) species in the overlying medium of cells treated as in A, over the indicated duration. N = 5 per group; *p < 0.05, **p < 0.01.
Figure 8.
Figure 8.
TFEB expression reduces steady-state cell-surface and intracellular APP levels without altering its endocytosis. A, B, Immunoblot (A) and quantitation (B) of cell-surface and internalized APP in N2a-APP695 cells transfected with TFEB or vector control, after cell-surface APP was labeled by biotinylation at 4°C (to prevent endocytosis) followed by rewarming (to 37°C) to stimulate its internalization by endocytosis (for 10 min). Cell-surface APP was assessed in cells maintained at 4°C. To assess internalized APP, cells were treated with 2-mercaptoethanesulfonic acid to remove cell-surface biotinylated APP molecules, followed by streptavidin capture and immunoblotting (see Materials and Methods). Inset shows ratio of internalized to surface APP; *p < 0.05. C–E, Immunoblot (C) and quantitation (D) of intracellular APP as a fraction of cell-surface APP to demonstrate kinetics of intracellular Aβ in cells transfected as in A and kinetics of uptake of biotinylated transferrin [immunoblot (C) with quantitation (E)] in cells treated as in A. N = 3 per group. No statistically significant differences were observed by two-way ANOVA.
Figure 9.
Figure 9.
TFEB expression enhances lysosomal degradation of APP. A–F, Immunoblot (A) with quantitation of APP (B), α-CTF (C), β-CTF (D), Aβ40 (E), and Aβ42 (F) in N2a-APP695 cells transfected with TFEB or vector control and cultured in the presence of bafilomycin A1 (Baf) or diluent for 4 h. P values shown are by post hoc test after one-way ANOVA. G, N2a-APP695 cells were transfected with TFEB or vector control and treated with cycloheximide (CHX; 50 μg/ml) at t = 0. Cells were collected at the indicated times to evaluate APP abundance. H, APP abundance expressed as a percentage of baseline (t = 0 after addition of cycloheximide) in cells treated as in C. N = 3 per group. Inset shows half-life of APP; *p < 0.05. I, N2a-APP695 cells were transfected with TFEB or vector control, and were pretreated with bafilomycin A1 or diluent (100 nm for 30 min) and treated with cycloheximide (50 μg/ml) at t = 0. Cells were collected at the indicated times to evaluate APP abundance. J, K, Quantitation of APP abundance at various times in cells treated as in I, in the vector-transfected (J) or TFEB-transfected (K) groups. N = 4 per group. L, Half-life of APP in bafilomycin A1-treated cells expressed as a percentage of diluent-treated group. N = 4 per group; *p < 0.05.

References

    1. Avrahami L, Farfara D, Shaham-Kol M, Vassar R, Frenkel D, Eldar-Finkelman H. Inhibition of glycogen synthase kinase-3 ameliorates beta-amyloid pathology and restores lysosomal acidification and mammalian target of rapamycin activity in the Alzheimer disease mouse model: in vivo and in vitro studies. J Biol Chem. 2013;288:1295–1306. doi: 10.1074/jbc.M112.409250. - DOI - PMC - PubMed
    1. Benowitz LI, Rodriguez W, Paskevich P, Mufson EJ, Schenk D, Neve RL. The amyloid precursor protein is concentrated in neuronal lysosomes in normal and Alzheimer disease subjects. Exp Neurol. 1989;106:237–250. doi: 10.1016/0014-4886(89)90156-8. - DOI - PubMed
    1. Bero AW, Yan P, Roh JH, Cirrito JR, Stewart FR, Raichle ME, Lee JM, Holtzman DM. Neuronal activity regulates the regional vulnerability to amyloid-beta deposition. Nat Neurosci. 2011;14:750–756. doi: 10.1038/nn.2801. - DOI - PMC - PubMed
    1. Bloom GS. Amyloid-beta and tau: the trigger and bullet in Alzheimer disease pathogenesis. JAMA Neurol. 2014;71:505–508. doi: 10.1001/jamaneurol.2013.5847. - DOI - PubMed
    1. Boland B, Smith DA, Mooney D, Jung SS, Walsh DM, Platt FM. Macroautophagy is not directly involved in the metabolism of amyloid precursor protein. J Biol Chem. 2010;285:37415–37426. doi: 10.1074/jbc.M110.186411. - DOI - PMC - PubMed

Publication types

MeSH terms

Substances

LinkOut - more resources