. 2015 Dec;25(12):1836-47.
doi: 10.1101/gr.191296.115. Epub 2015 Sep 3.

Ribosome profiling reveals an important role for translational control in circadian gene expression

Affiliations

Ribosome profiling reveals an important role for translational control in circadian gene expression

Christopher Jang et al. Genome Res. 2015 Dec.

Abstract

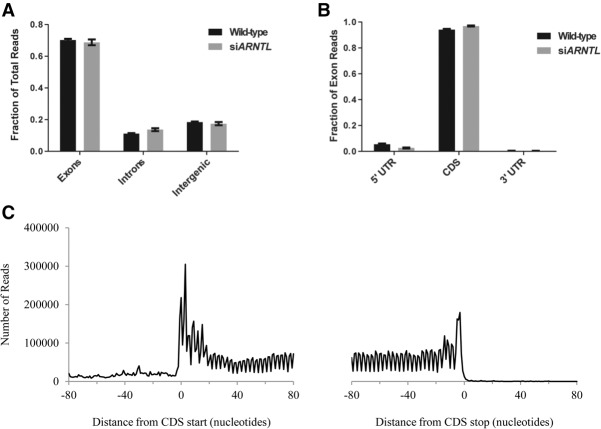
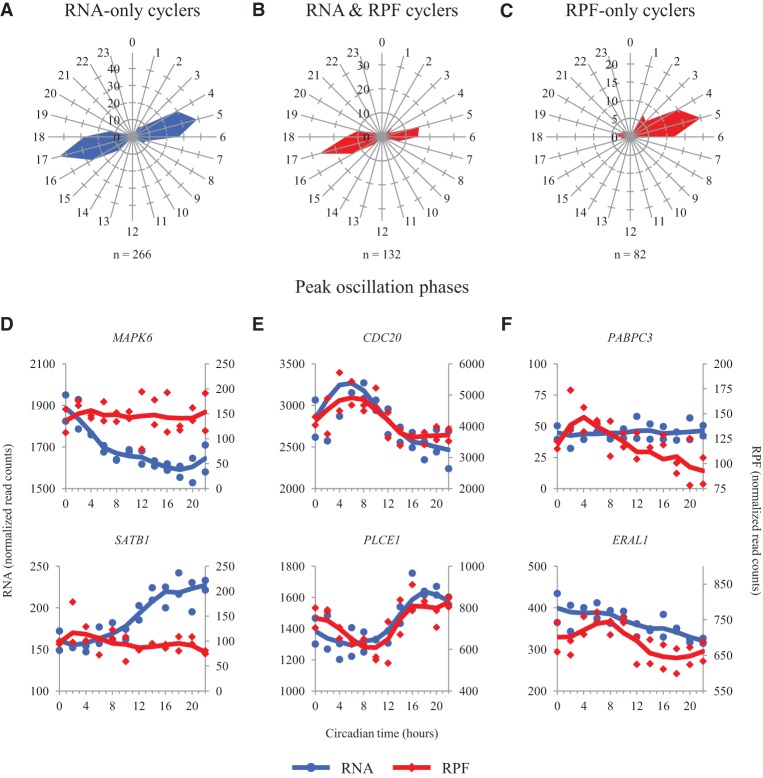
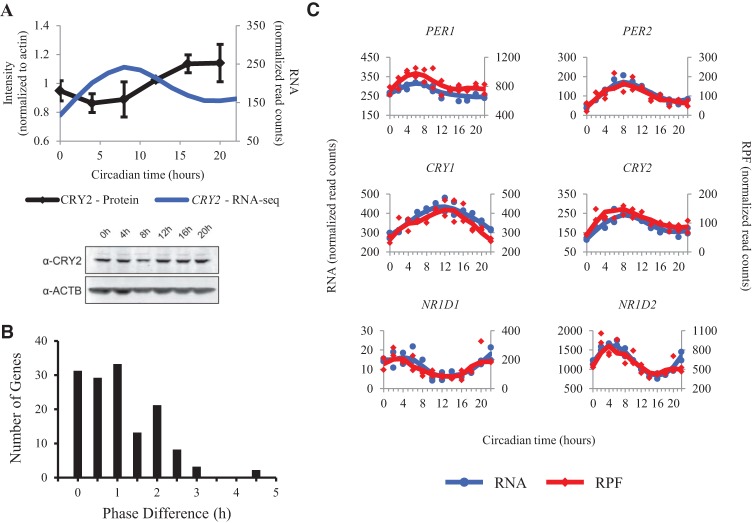
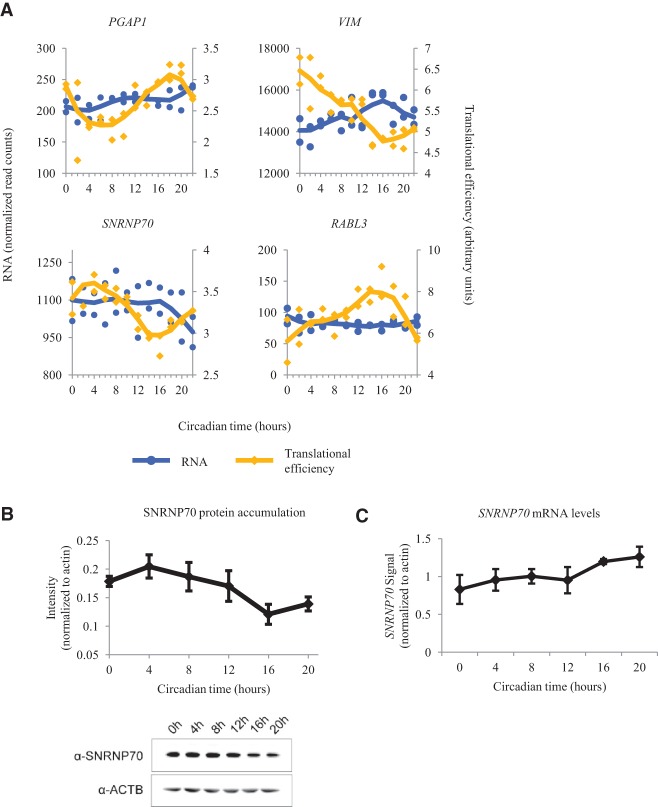
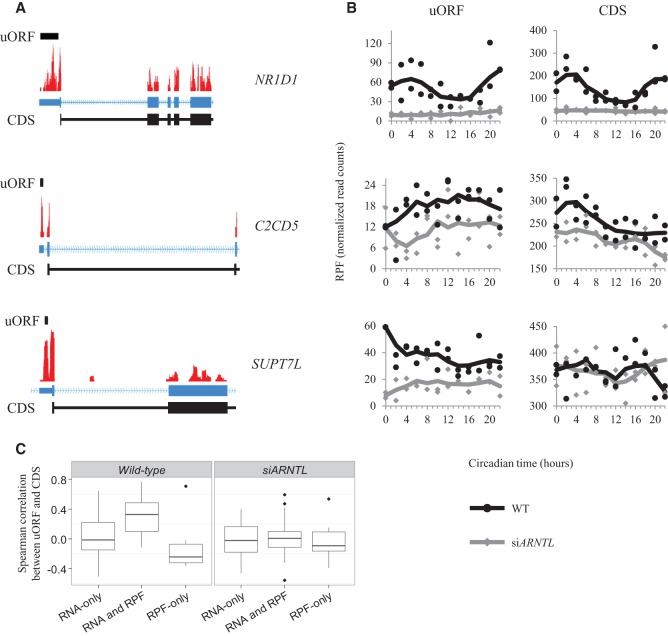
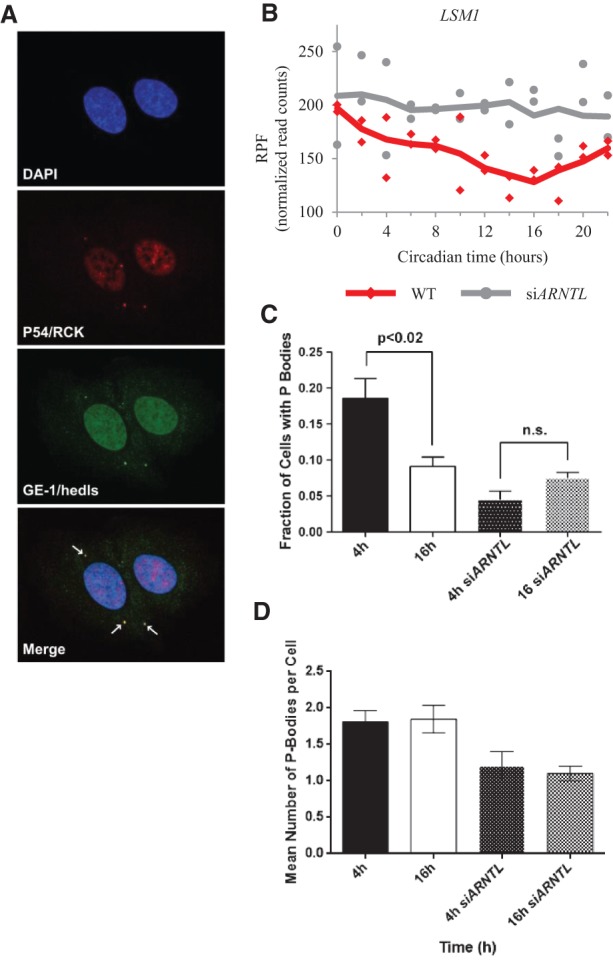
Physiological and behavioral circadian rhythms are driven by a conserved transcriptional/translational negative feedback loop in mammals. Although most core clock factors are transcription factors, post-transcriptional control introduces delays that are critical for circadian oscillations. Little work has been done on circadian regulation of translation, so to address this deficit we conducted ribosome profiling experiments in a human cell model for an autonomous clock. We found that most rhythmic gene expression occurs with little delay between transcription and translation, suggesting that the lag in the accumulation of some clock proteins relative to their mRNAs does not arise from regulated translation. Nevertheless, we found that translation occurs in a circadian fashion for many genes, sometimes imposing an additional level of control on rhythmically expressed mRNAs and, in other cases, conferring rhythms on noncycling mRNAs. Most cyclically transcribed RNAs are translated at one of two major times in a 24-h day, while rhythmic translation of most noncyclic RNAs is phased to a single time of day. Unexpectedly, we found that the clock also regulates the formation of cytoplasmic processing (P) bodies, which control the fate of mRNAs, suggesting circadian coordination of mRNA metabolism and translation.


Figures

Figure 1.
Figure 1.
Analysis of ribosome profiling data. (A) A bar graph displaying the fraction of total RPF reads mapping to introns, exons, and inter-genic regions of the genome. (B) A bar graph displaying the fraction of total exon reads mapping to coding sequence, 5′, or 3′ untranslated regions of genes. (C) The distribution of ribosome A-sites by nucleotide position within a gene, relative to the start and stop codons. Data are aggregated from the 1000 genes with the highest number of RPF reads in the wild-type data.
Figure 2.
Figure 2.
Peak RNA and RPF timing in cycling genes. (AC) Radial diagrams displaying circadian phase information for those genes that (A) oscillate in the RNA data only (RNA FDR < 0.05; RPF P > 0.2), (B) oscillate in the RNA and RPF data (RNA FDR < 0.05; RPF FDR < 0.2), and (C) oscillate in the RPF data only (RPF FDR < 0.2; RNA P > 0.2). Note that B depicts phase data for both RNA and RPF, as both show peaks at the same time of day; A and C depict phases for RNA and RPF, respectively. The number of genes in each set is displayed below the corresponding radial diagrams. The blue and red radial diagrams display phase information for RNA and RPF data, respectively. All phases were calculated using JTK_CYCLE. (DF) RNA and RPF traces for two representative genes in each of the above groups are plotted as a function of circadian time. (D) MAPK6 and SATB1 oscillate in the RNA data only. (E) CDC20 and PLCE1 oscillate in both the RNA and RPF data. (F) PABPC3 and ERAL1 oscillate in the RPF data only. Blue traces for the RNA data use the axes on the left. Red traces for the RPF data use the axes on the right. Points from both replicates are displayed, and the lines are plotted using a moving average (see Supplemental Methods for further detail). Traces from siARNTL libraries are displayed in Supplemental Figure S8.
Figure 3.
Figure 3.
The transcription and translation of the transcriptional repressors of the circadian clock are synchronous. (A, top) The average CRY2 band intensity from three protein immunoblots in wild-type synchronized U2OS cells is plotted as a function of time. All measurements were normalized to beta-actin. Error bars represent standard error of the mean. mRNA abundance measurements for CRY2 from total RNA-seq are plotted alongside for comparison. This is the same line displayed in part C of this figure. (A, bottom) Representative protein immunoblots for CRY2 and beta-actin are shown. (B) The lag in time between peak RPF and peak mRNA level is plotted for all genes that oscillate in both RNA and RPF data. Phases were calculated using JTK_CYCLE. (C) RNA and RPF traces for the negative regulators of the circadian clock are plotted as a function of time. Blue traces for the RNA data use the axes on the left. Red traces for the RPF data use the axes on the right. Points from both replicates are displayed, and the lines are plotted using a moving average (see Supplemental Methods for further detail). Traces from siARNTL libraries are displayed in Supplemental Figure S9.
Figure 4.
Figure 4.
Analysis of genes that are translationally regulated by the circadian clock. (A) Traces for RNA and translational efficiency (TE) from PGAP1, VIM, SNRNP70, and RABL3 are plotted as a function of time. Blue traces for the RNA data use the axes on the left. Yellow traces for the TE data use the axes on the right. Points from both replicates are displayed, and the lines are plotted using a moving average (see Supplemental Methods for further detail). Traces from siARNTL libraries are displayed in Supplemental Figure S10. (B) The average SNRNP70 band intensity from eight protein immunoblots in wild-type synchronized U2OS cells is plotted as a function of time. A representative Western blot is shown at the bottom. (C) Average quantitative PCR measurements of SNRNP70 mRNA. All measurements were normalized to beta-actin. Error bars represent standard error of the mean.
Figure 5.
Figure 5.
Translation of upstream open reading frames. (A) Coverage plots for RPF data mapped to the NR1D1, C2CD5, and SUPT7L loci are plotted. The locations of the uORFs are identified by the black bar above the coverage plot. The gene models for these genes are displayed in blue below the coverage plots. Blocks correspond to exons, and lines indicate introns. The thick blocks indicate the annotated coding region, while the thin blocks correspond to the annotated untranslated region. The chevrons within the intronic lines indicate the direction of transcription. CDS regions are displayed in black below the gene models. The regions displayed are truncated for visualization purposes. (B) RPF traces from the uORF and coding sequences are plotted as a function of time. The black traces are from the wild-type RPF libraries, while the gray traces are from the siARNTL RPF libraries. (C) Box plots for the distribution of Spearman correlation coefficients between uORF and CDS data are displayed for each of the three gene groups (RNA-only cyclers, RNA and RPF cyclers, RPF-only cyclers). These distributions are plotted for both the wild-type and siARNTL data.
Figure 6.
Figure 6.
The circadian clock regulates cytoplasmic processing body formation. (A) Confocal immunofluorescence images of the P body markers, P54/RCK and GE-1/HEDLS, are shown at a representative time point when P bodies were found to be present in U2OS cells. DAPI was used as a nuclear counterstain. P body foci are indicated with arrows in the merged image. (B) Normalized RPF reads for the LSM1 gene as a function of time for both the wild-type (red) and siARNTL (gray) data. Points from both replicates are displayed, and the lines are plotted using a moving average (see Supplemental Methods for further detail). (C) A graph representing the number of cells with P bodies at the 4- and 16-h time points for both synchronized wild-type and siARNTL U2OS cells. Error bars represent standard deviations. (D) A graph representing the average number of P bodies per cell at the 4- and 16-h time points for both synchronized wild-type and siARNTL U2OS cells. Error bars represent standard deviations.

References

    1. Aizer A, Kafri P, Kalo A, Shav-Tal Y. 2013. The P body protein Dcp1a is hyper-phosphorylated during mitosis. PLoS One 8: e49783. - PMC - PubMed
    1. Anders S, Huber W. 2010. Differential expression analysis for sequence count data. Genome Biol 11: R106. - PMC - PubMed
    1. Anders S, Pyl PT, Huber W. 2015. HTSeq—a Python framework to work with high-throughput sequencing data. Bioinformatics 31: 166–169. - PMC - PubMed
    1. Andrei MA, Ingelfinger D, Heintzmann R, Achsel T, Rivera-Pomar R, Luhrmann R. 2005. A role for eIF4E and eIF4E-transporter in targeting mRNPs to mammalian processing bodies. RNA 11: 717–727. - PMC - PubMed
    1. Baggs JE, Price TS, DiTacchio L, Panda S, Fitzgerald GA, Hogenesch JB. 2009. Network features of the mammalian circadian clock. PLoS Biol 7: e52. - PMC - PubMed

Publication types

Associated data