Comparative Study
. 2015 Sep 4:5:13796.
doi: 10.1038/srep13796.

Electrophysiological evidences demonstrating differences in brain functions between nonmusicians and musicians

Affiliations
Comparative Study

Electrophysiological evidences demonstrating differences in brain functions between nonmusicians and musicians

Li Zhang et al. Sci Rep. .

Abstract

Long-term music training can improve sensorimotor skills, as playing a musical instrument requires the functional integration of information related to multimodal sensory perception and motor execution. This functional integration often leads to functional reorganization of cerebral cortices, including auditory, visual, and motor areas. Moreover, music appreciation can modulate emotions (e.g., stress relief), and long-term music training can enhance a musician's self-control and self-evaluation ability. Therefore, the neural processing of music can also be related to certain higher brain cognitive functions. However, evidence demonstrating that long-term music training modulates higher brain functions is surprisingly rare. Here, we aimed to comprehensively explore the neural changes induced by long-term music training by assessing the differences of transient and quasi-steady-state auditory-evoked potentials between nonmusicians and musicians. We observed that compared to nonmusicians, musicians have (1) larger high-frequency steady-state responses, which reflect the auditory information processing within the sensory system, and (2) smaller low-frequency vertex potentials, which reflect higher cognitive information processing within the novelty/saliency detection system. Therefore, we speculate that long-term music training facilitates "bottom-up" auditory information processing in the sensory system and enhances "top-down" cognitive inhibition of the novelty/saliency detection system.


Figures
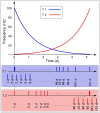
Figure 1
Figure 1. Quasi-steady-state auditory stimuli.
The quasi-steady-state auditory stimuli, presented at a comfortable listening level (~80 dB SPL) through binaural earphones, consisted of trains of 1 ms monotone pulses (101 pulses for each train, i.e., P1, P2, …, P101). Two types of train, i.e., descending train and ascending train, are respectively marked in blue and red. In the descending train, the inter-pulse intervals (IPIs), which were changed from 10 ms to 1000 ms, were 1000/100 ms between P1 and P2, 1000/99 ms between P2 and P3, 1000/98 ms between P3 and P4, …, 1000/1 ms between P100 and P101. In this case, the stimulus frequencies were 100, 99, 98, …, 1 Hz for the consecutive pulses. In the ascending train, the IPIs, which were changed from 1000 ms to 10 ms, were 1000/1 ms between P1 and P2, 1000/2 ms between P2 and P3, 1000/3 ms between P3 and P4, …, 1000/100 ms between P100 and P101. The stimulus frequencies were 1, 2, 3, …, 100 Hz for the consecutive pulses in this type of train.
Figure 2
Figure 2. The comparison of event-related potentials (ERPs) evoked by transient auditory stimuli between nonmusicians and musicians.
ERPs evoked by transient auditory stimuli (group-level average; FCz-A1A2) from nonmusicians and musicians are respectively marked in red and blue. x axis, latency (ms); y axis, amplitude (μV). The scalp topographies of N1 and P2 in auditory ERPs, from both nonmusicians and musicians, are displayed in the upper and lower parts respectively. Gray scale represents the P values obtained for each time point using an independent sample t-test to assess the significant difference of auditory ERPs between nonmusicians and musicians. Whereas N1 latencies and amplitudes were not significantly different between nonmusicians and musicians, P2 latencies were significantly shorter and P2 amplitudes were significantly larger for nonmusicians than musicians.
Figure 3
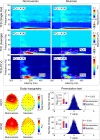
Figure 3. The comparison of time-frequency distributions (TFDs) elicited by transient auditory stimuli between nonmusicians and musicians.
Top panel: Being elicited by transient auditory stimuli, TFDs of auditory-induced responses (single trial), auditory-evoked responses (average), and phase-locking values (PLVs) (group-level average; FCz-A1A2) are displayed from top to bottom for nonmusicians (left) and musicians (right) respectively. x axis, latency (ms); y axis, frequency (Hz). The region-of-interests (ROIs), outlined in purple curves, had (1) significantly different TFD values than those within the pre-stimulus interval and (2) significantly different TFD values between nonmusicians and musicians. Bottom left panel: The scalp topographies, measured from the corresponding ROIs of evoked TFDs (ROI1) and PLVs (ROI2), are respectively displayed in the upper and lower parts for nonmusicians (left) and musicians (right). Bottom right panel: Statistical t values and corresponding null distributions within the ROIs of evoked TFDs (ROI1) and PLVs (ROI2) are displayed in the upper and lower parts respectively. Null distributions were generated from 5000 random permutations from all datasets. Statistical t values are indicated by vertical red lines. Within ROI1, permutation tests showed that the t value of the comparison of evoked TFDs between nonmusicians and musicians was significantly different from chance level (P = 0.002). Within ROI2, permutation tests showed that the t value of the PLV comparison between nonmusicians and musicians was significantly different from chance level (P < 0.001).
Figure 4
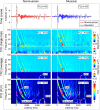
Figure 4. The comparison of neural responses elicited by descending trains of quasi-steady-state auditory stimuli between nonmusicians and musicians.
ERPs and TFDs of auditory-induced responses (single trial), auditory-evoked responses (average), and PLVs (group-level average; FCz-A1A2) are displayed from top to bottom for nonmusicians (left) and musicians (right) respectively. The region-of-interests (ROIs), outlined in purple curves, had (1) significantly different TFD values than those within the pre-stimulus interval and (2) significantly different TFD values between nonmusicians and musicians.
Figure 5
Figure 5. ROI analysis comparing neural responses elicited by descending trains of quasi-steady-state auditory stimuli between nonmusicians and musicians.
Left panel: The scalp topographies, measured from the corresponding ROIs of evoked TFDs (ROI1) and PLVs (ROI2 and ROI3; outlined in Fig. 4), are displayed from top to bottom for nonmusicians (left) and musicians (right) respectively. Right panel: Statistical t values and corresponding null distributions within the ROIs of evoked TFDs (ROI1) and PLVs (ROI2 and ROI3) are displayed from top to bottom. Null distributions were generated from 5000 random permutations from all datasets. Statistical t values are indicated by vertical red lines. Within ROI1, permutation tests showed that the t value of the comparison of evoked TFDs between nonmusicians and musicians was significantly different from chance level (P = 0.014). Within ROI2 and ROI3, permutation tests showed that the t values of the PLV comparisons between nonmusicians and musicians were significantly different from chance level (P = 0.009 and P = 0.001 respectively).
Figure 6
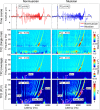
Figure 6. The comparison of neural responses elicited by ascending trains of quasi-steady-state auditory stimuli between nonmusicians and musicians.
ERPs and TFDs of auditory-induced responses (single trial), auditory-evoked responses (average), and PLVs (group-level average; FCz-A1A2) are displayed from top to bottom for nonmusicians (left) and musicians (right) respectively. The region-of-interests (ROIs), outlined in purple curves, had (1) significantly different TFD values than those within the pre-stimulus interval and (2) significantly different TFD values between nonmusicians and musicians.
Figure 7
Figure 7. ROI analysis comparing neural responses elicited by ascending trains of quasi-steady-state auditory stimuli between nonmusicians and musicians.
Left panel: The scalp topographies, measured from the corresponding ROIs of evoked TFDs (ROI1) and PLVs (ROI2 and ROI3; outlined in Fig. 6), are displayed from top to bottom for nonmusicians (left) and musicians (right) respectively. Right panel: Statistical t values and corresponding null distributions within the ROIs of evoked TFDs (ROI1) and PLVs (ROI2 and ROI3) are displayed from top to bottom. Null distributions were generated from 5000 random permutations from all datasets. Statistical t values are indicated by vertical red lines. Within ROI1, permutation tests showed that the t value of the comparison of evoked TFDs between nonmusicians and musicians was significantly different from chance level (P = 0.001). Within ROI2 and ROI3, permutation tests showed that the t values of the PLV comparisons between nonmusicians and musicians were significantly different from chance level (P = 0.007 and P = 0.002 respectively).

Similar articles

Cited by

References

    1. Pallesen K. J. et al. Cognitive Control in Auditory Working Memory Is Enhanced in Musicians. PloS ONE 5, e11120 (2010). - PMC - PubMed
    1. Musacchia G., Sams M., Skoe E. & Kraus N. Musicians have enhanced subcortical auditory and audiovisual processing of speech and music. P Natl Acad Sci USA 104, 15894–15898 (2007). - PMC - PubMed
    1. Strait D. L., Kraus N., Parbery-Clark A. & Ashley R. Musical experience shapes top-down auditory mechanisms: Evidence from masking and auditory attention performance. Hearing Res 261, 22–29 (2010). - PubMed
    1. Gaser C. & Schlaug G. Brain structures differ between musicians and non-musicians. J Neurosci 23, 9240–9245 (2003). - PMC - PubMed
    1. Ohnishi T. et al. Functional anatomy of musical perception in musicians. Cereb Cortex 11, 754–760 (2001). - PubMed

Publication types

LinkOut - more resources