. 2015 Oct 21;15(20):4090-8.
doi: 10.1039/c5lc00875a. Epub 2015 Sep 4.

Low-voltage paper isotachophoresis device for DNA focusing

Affiliations

Low-voltage paper isotachophoresis device for DNA focusing

Xiang Li et al. Lab Chip. .

Abstract

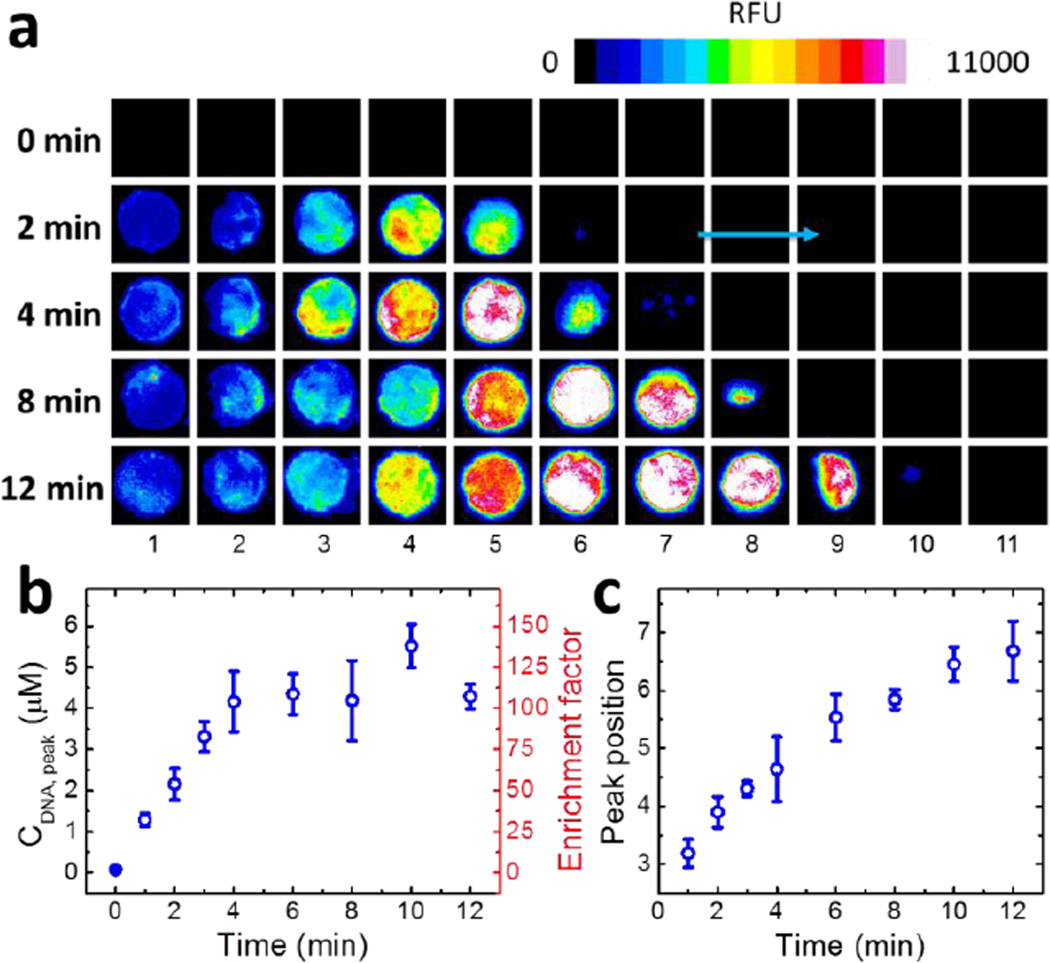
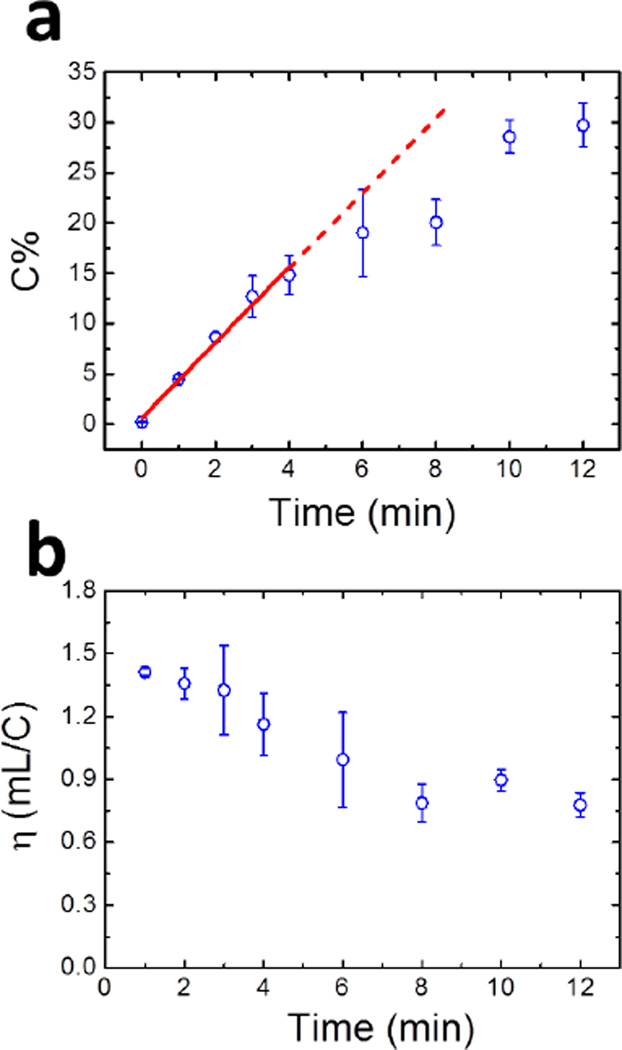
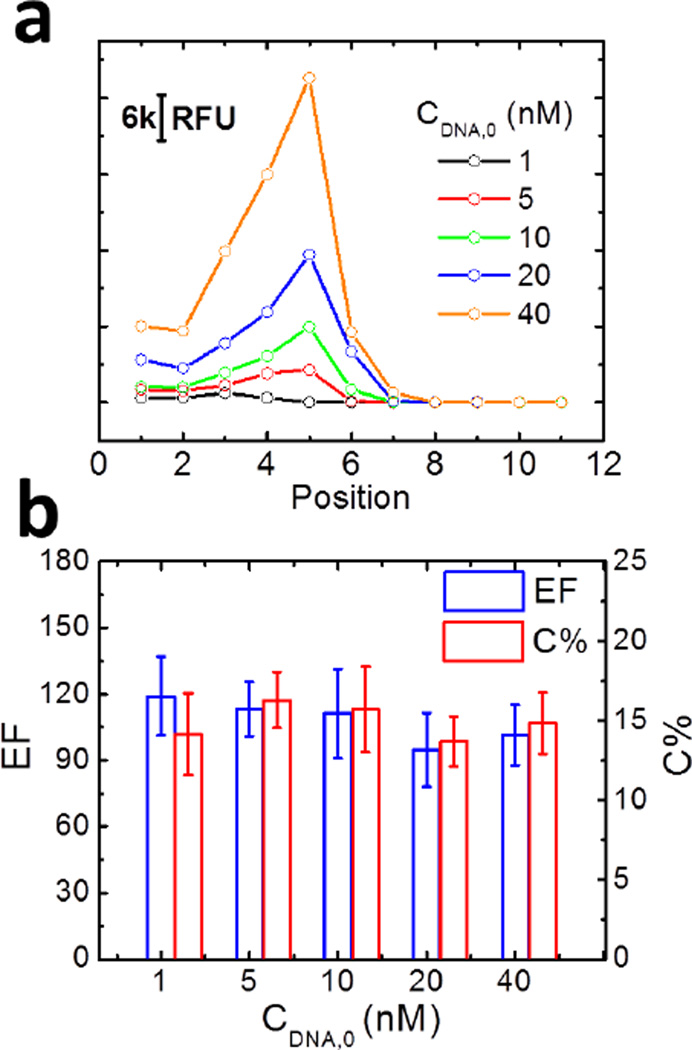
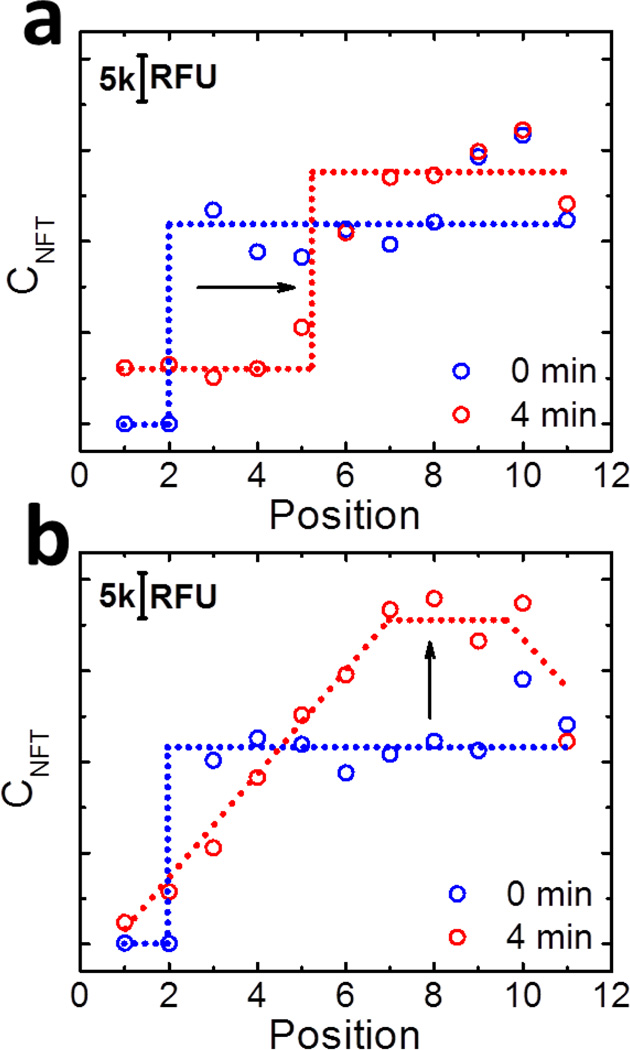
We present a new paper-based isotachophoresis (ITP) device design for focusing DNA samples having lengths ranging from 23 to at least 1517 bp. DNA is concentrated by more than two orders of magnitude within 4 min. The key component of this device is a 2 mm-long, 2 mm-wide circular paper channel formed by concertina folding a paper strip and aligning the circular paper zones on each layer. Due to the short channel length, a high electric field of ~16 kV m(-1) is easily generated in the paper channel using two 9 V batteries. The multilayer architecture also enables convenient reclamation and analysis of the sample after ITP focusing by simply opening the origami paper and cutting out the desired layers. We profiled the electric field in the origami paper channel during ITP experiments using a nonfocusing fluorescent tracer. The result showed that focusing relied on formation and subsequent movement of a sharp electric field boundary between the leading and trailing electrolyte.


Figures

Figure 1
Figure 1
ITP focusing of ssDNA using an 11-layer oPAD-ITP. (a) Time-resolved fluorescence micrographs of ssDNA during focusing at 18 V. The TE and LE were 2.0 mM tris-taurine (pH 8.7) and 1.0 M tris-HCl (pH 7.3), respectively, and the initial TE/LE boundary was between Layers 2 and 3. The initial ssDNA concentration in the TE solution was 40.0 nM. (b) Plot of the ssDNA peak concentration as a function of time. The peak concentrations were calculated from the images in (a). (c) Plot of peak position (in terms of layer number) as a function of time. The peak positions were obtained by Gaussian fitting of the ssDNA distributions shown in Figure S4. The error bars in (b) and (c) represent the standard deviation for three independent replicates.
Figure 2
Figure 2
Focusing data for ssDNA using an 11-layer oPAD-ITP. (a) Plot of collection efficiency (C%) as a function of time. C% was calculated by comparing the amount of ssDNA injected into the device with the sum of the amount of ssDNA present on each paper layer following ITP. (b) Plot of extraction efficiency (η) as a function of time. The definition of η is given in eq 3. The raw data used to generate the plots in (a) and (b) are shown in Figures 1 and S4. The error bars represent the standard deviation for three independent replicates.
Figure 3
Figure 3
Focusing data as a function of the initial concentration of ssDNA for an 11-layer oPAD-ITP. (a) Distribution of ssDNA as a function of position (paper layer number) and initial ssDNA concentration after 4.0 min of ITP at 18 V. Each data point was calculated by integrating the RFU of the fluorescence image of each paper layer. (b) Enrichment factor (EF) and collection efficiency (C%) as a function of the initial ssDNA concentration. The ssDNA concentration was calculated by comparing integrated RFU value with the calibration curve shown in Figure S3. The error bars represent the standard deviation for three independent replicates.
Figure 4
Figure 4
Electric field profiles in an oPAD-ITP obtained using Ru(bpy)32+ as a NFT. Each data point represents the integrated RFU value of the fluorescence image of each paper layer. The dash lines represent the guidelines for the NFT distributions, which corresponding to electric field strength in the channel. (a) Distributions of the NFT before application of the voltage and at t = 4 min. Initially, the LE solution contained 30.0 µM Ru(bpy)32+. (b) Distribution of the NFT before application of the voltage and at t = 4 min. For this experiment both reservoirs were filled with LE solution, but the NFT was only present in the anodic reservoir adjacent to Layer 11. To avoid oxidation of Cl at the anode, Ag/AgCl wire electrodes replaced the Pt wire electrodes used in (a). For all experiments the applied voltage was 18 V.
Figure 5
Figure 5
ITP focusing of a 100 bp dsDNA ladder. Initially, 1.0 µL of a 500 µg/mL solution of the 100 bp dsDNA ladder was dissolved in 1.0 mL of the TE solution (final dsDNA concentration: 0.5 µg/mL). Following 10 min of ITP of this solution at 18 V, each fold of the 11-layer oPAD-ITP was cut from the device, and gel electrophoresis was used to elute the dsDNA in that layer (Figure S2). (a) The left panel is a fluorescence micrograph of the gel after electrophoresis and staining with 10 µg/mL EtBr. The numbers under the lanes of the gel correspond to the Layer numbers of the oPAD-ITP. The right panel is a control experiment showing the result of gel electrophoresis of a paper fold onto which 1.0 µL of a 500 µg/mL dsDNA ladder solution was dispensed (no ITP). The gel electrophoresis conditions for all paper folds were: 1.3% agarose gel, 100 V, and 50 min. (b) The black lines are fluorescence line profiles of the stained gels in each lane of the left panel in (a). The integral of the profiles is represented by the blue bar. (c) The black line is the fluorescence line scan of the gel in the right panel in (a). The blue hollow and red solid bars represent the total dsDNA placed in the reservoir prior to ITP and the total collected dsDNA on the oPAD-ITP, respectively. The calculated C% values for each dsDNA length are shown in the right-most column.
Scheme 1
Scheme 1

Similar articles

Cited by

References

    1. Jung B, Bharadwaj R, Santiago JG. On-chip millionfold sample stacking using transient isotachophoresis. Anal. Chem. 2006;78:2319–2327. - PubMed
    1. Liu H, Crooks RM. Three-Dimensional Paper Microfluidic Devices Assembled Using the Principles of Origami. J. Am. Chem. Soc. 2011;133:17564–17566. - PubMed
    1. Luo L, Li X, Crooks RM. Low-Voltage Origami-Paper-Based Electrophoretic Device for Rapid Protein Separation. Anal. Chem. 2014;86:12390–12397. - PubMed
    1. Carrilho E, Martinez AW, Whitesides GM. Understanding Wax Printing: A Simple Micropatterning Process for Paper-Based Microfluidics. Anal. Chem. 2009;81:7091–7095. - PubMed
    1. Du WB, Li L, Nichols KP, Ismagilov RF. SlipChip. Lab Chip. 2009;9:2286–2292. - PMC - PubMed

Publication types

MeSH terms

Substances