. 2015 Oct 15;43(18):8694-712.
doi: 10.1093/nar/gkv865. Epub 2015 Sep 3.

A predictive modeling approach for cell line-specific long-range regulatory interactions

Affiliations

A predictive modeling approach for cell line-specific long-range regulatory interactions

Sushmita Roy et al. Nucleic Acids Res. .

Erratum in

Abstract

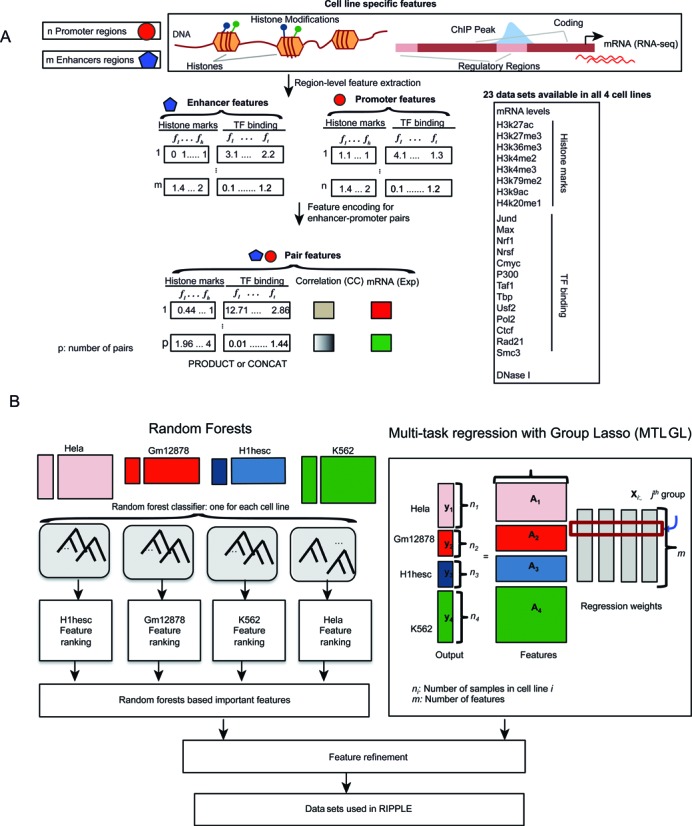
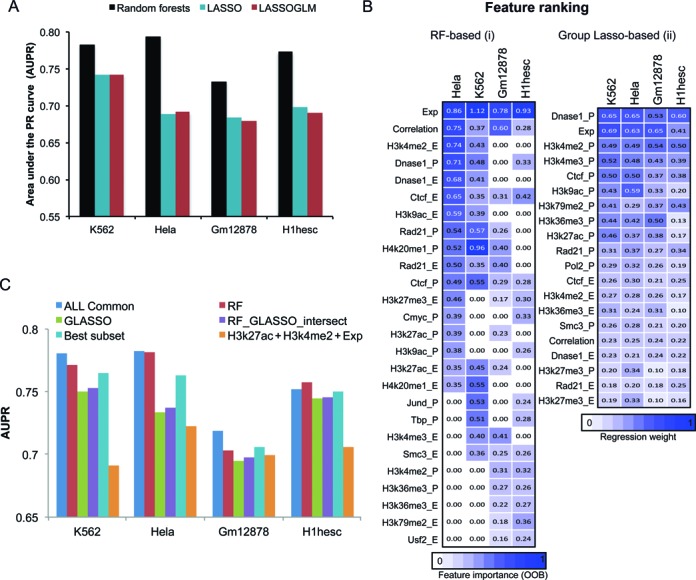
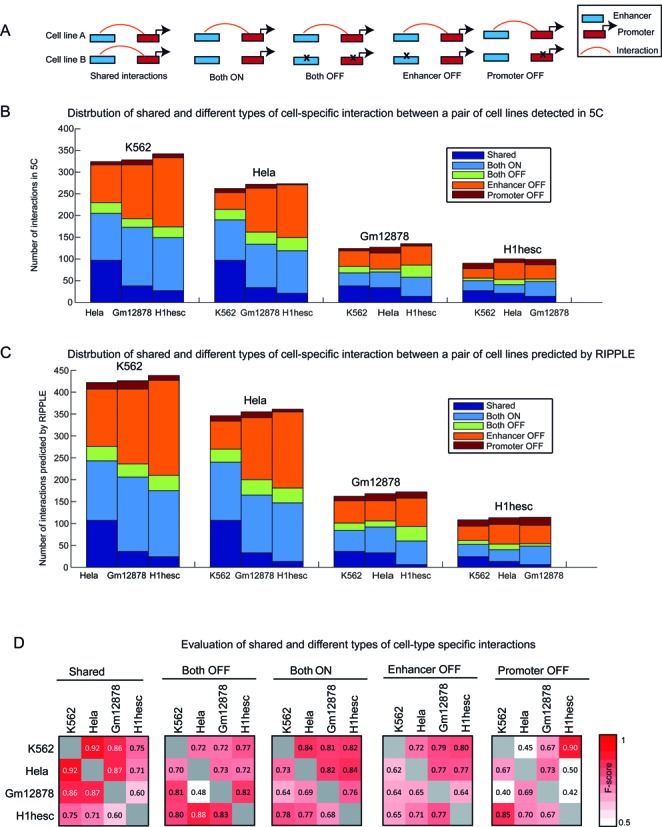
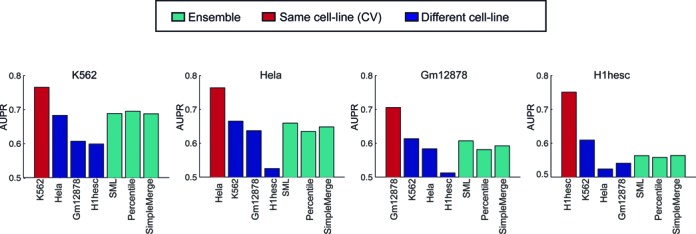
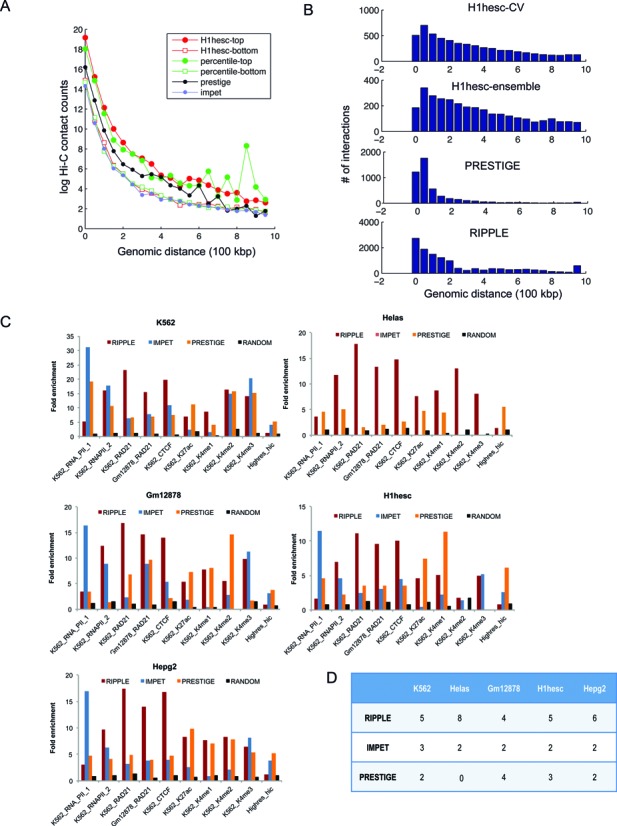
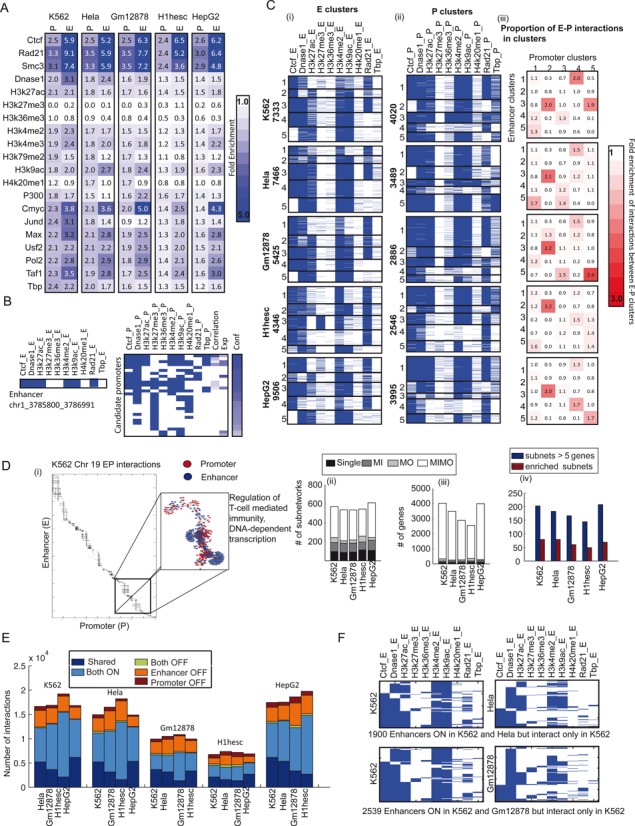
Long range regulatory interactions among distal enhancers and target genes are important for tissue-specific gene expression. Genome-scale identification of these interactions in a cell line-specific manner, especially using the fewest possible datasets, is a significant challenge. We develop a novel computational approach, Regulatory Interaction Prediction for Promoters and Long-range Enhancers (RIPPLE), that integrates published Chromosome Conformation Capture (3C) data sets with a minimal set of regulatory genomic data sets to predict enhancer-promoter interactions in a cell line-specific manner. Our results suggest that CTCF, RAD21, a general transcription factor (TBP) and activating chromatin marks are important determinants of enhancer-promoter interactions. To predict interactions in a new cell line and to generate genome-wide interaction maps, we develop an ensemble version of RIPPLE and apply it to generate interactions in five human cell lines. Computational validation of these predictions using existing ChIA-PET and Hi-C data sets showed that RIPPLE accurately predicts interactions among enhancers and promoters. Enhancer-promoter interactions tend to be organized into subnetworks representing coordinately regulated sets of genes that are enriched for specific biological processes and cis-regulatory elements. Overall, our work provides a systematic approach to predict and interpret enhancer-promoter interactions in a genome-wide cell-type specific manner using a few experimentally tractable measurements.


Figures

Figure 1.
Figure 1.
RIPPLE classification framework for predicting cell-line specific enhancer-promoter interactions. The two main stages of building RIPPLE's cell line-specific classifier: identification of appropriate feature encoding and selection of minimal data sets. (A) Encoding an enhancer-promoter pair for a classifier. ChIP-seq (for general transcription factors and histone modifications), DNase I and RNA-seq data sets measured in a given cell line provide feature values for an enhancer or a promoter genomic region. The feature values can be continuous (negative log of P-value of signal enrichment, gene expression levels) or binary (presence absence of a particular peak). To represent an enhancer and promoter pair to a classifier, we use two strategies: CONCAT and PRODUCT. In CONCAT, we concatenate the feature vector associated with an enhancer with the feature vector associated with a promoter. In PRODUCT, we use the product of the feature value on the enhancer and the promoter to specify the feature value of the pair. We also use the correlation of the signal values on the enhancer and promoter as an additional feature. (B) Our hybrid approach to identifying the minimal feature set for building cell line-specific classifier. We train cell line-specific Random Forests on labeled 5C data and use standard feature importance measures (out-of-bag error) in Random Forests to rank the features. In parallel, we use a multi-task learning with Group Lasso to perform joint feature selection across all four cell lines. The intersection of both approaches is used as input for the feature refinement step, where we remove and add individual, pairs or triplets of features guided by the correlation of the features. The output of this step gives us a minimal set of data sets for RIPPLE.
Figure 2.
Figure 2.
Evaluation of different feature encodings and classification algorithms for enhancer-promoter interaction prediction. (A) Area Under the Precision-Recall curve (AUPR) values for all four cell lines and the three classification approaches tested. These approaches include the Random Forests classifier, a regularized linear regression approach (LASSO) and a regularized logistic regression approach (LASSOGLM). The higher the bar the better the particular classification approach. (B) Top selected features using Random Forests and Group Lasso. For Random forests the feature importance is the out of bag error when the feature is included in the top 20, and 0 otherwise, and for Group Lasso the feature importance is the absolute value of the regression coefficient. (C) AUPRs on different combinations of data sets: ALL Common: all 23 data sets, GLASSO: 13 data sets selected by Group Lasso, RF: 17 data sets selected by Random Forests feature ranking, RF_GLASSO_intersect: 12 data sets in the intersection of data sets selected by Group Lasso and Random Forests, H3k27ac+H3k4me2+Exp: 3 data sets including H3K27ac, H3K4me2 and RNA-seq based gene expression levels.
Figure 3.
Figure 3.
Characterization of different types of cell line-specific interactions. (A) Shown are the different statuses of an interaction comparing a pair of cell lines, (A) and (B). These statuses can be, ‘shared’, or cell-line specific. Cell-line specific interactions in turn can be grouped into ‘Both OFF’, ‘Enhancer OFF’, ‘Promoter ON’ and ‘Both ON’. (B) Shown are the relative proportions of the different interaction types in the 5C data when comparing each cell line to one of the other three cell lines. (C) Shown are the relative proportions of the different interaction types in the RIPPLE predicted interaction networks. The relative proportions of different types of interactions are similar between RIPPLE and 5C. (D) Shown is the agreement (as measured by F-score values) of interactions in different categories predicted based on RIPPLE and based on 5C. The higher the F-score the greater the agreement.
Figure 4.
Figure 4.
Predicting interactions in new cell lines. Ability of RIPPLE to recover interactions in a new cell line on which the classifier is not trained on. The red bar corresponds to the best case performance, i.e. when using cross-validation in the same cell line. The red bars correspond to the AUPRs when using a classifier from a different cell line. The cyan bars correspond to the ensemble based predictions: Percentile, SML (Spectral Meta Learner), SimpleMerge are the three types of ensemble approaches we used to pool information from different cell lines to predict interactions in a new cell line not used for training.
Figure 5.
Figure 5.
Evaluation of genome-wide enhancer-promoter interaction maps. (A) Shown is the distribution of normalized Hi-C contact count frequencies in genome-wide predictions for the H1hesc cell line. H1hesc-top: the interactions in the 90% confidence of the classifier trained using only H1hesc 5C data, H1hesc-bottom: interactions predicted at 10% confidence by the classifier trained only on the H1hesc data, percentile-top and percentile-bottom: Same as in H1hesc-top and bottom but using predictions from the percentile ensemble. PRESTIGE: interactions obtained from the PRESTIGE method, IMPET: interactions obtained from the IM-PET method. (B) Distribution of the number of interactions as a function of genomic distance using H1hesc-only classifier (RIPPLE H1hesc CV), Ensemble (RIPPLE H1hesc Ensemble), PRESTIGE and IMPET. (C) Fold enrichment of predicted interactions from RIPPLE, IMPET and PRESTIGE in experimental data sets of long-range interactions generated using ChIA-PET or high-resolution Hi-C. Each barplot shows a fold-enrichment measure of the number of recovered interactions of a particular type in the high confidence set of interactions. The RNA_PolII_1 data set is from Li et al., whereas the RNA_POLII_2 data set is from Heidari et al. All data sets other than Hires_Hi-C are ChIA-PET data sets. (D) Shown is the number of data sets for different cell lines (column) in which a method (row) was the best (highest fold enrichment) among the three methods compared. The greater the number the more often was a method ranked the best.
Figure 6.
Figure 6.
Properties of genome-wide enhancer-promoter interactions. (A) Enrichment of various individual genomic signals in the enhancers and promoters in the high confidence networks. The stronger the intensity of blue the better the enrichment. (B) Example of an enhancer from the K562 cell line and candidate promoters that are in its 1 MB radius. The promoters are ranked by RIPPLE confidence (Conf; min 0.5). The _E and _P features are binary (0: white, 1: blue), while the Correlation and Expression (Exp) features are continuous. (C) Clusters of enhancers and promoters in the five cell lines. (i) Enhancer clusters, each cluster is numbered 1–5, and the number of enhancers are shown on the side. (ii) Promoter clusters, numbered 1–5, with the number of promoters in each cluster shown on the side. Blue indicates the presence of a feature and white indicates absence. (iii) Fold enrichment of interactions between an enhancer cluster (row) to a promoter cluster (column) compared to the expected number of interactions between these clusters. The more red the intensity the greater is the tendency for enhancers from one cluster to interact with promoters from another cluster. (D) Enhancer-promoter interaction landscape for Chromosome 19 in K562. (i) The enhancer-promoter interactions for subnetworks extracted from a connected components analysis. The blow-up shows an example set of promoters regulated by multiple enhancers and enriched for transcriptional as well as immune response processes. (ii–iv), Distribution of enhancer-promoter interactions in different types of subnetworks. The majority of the interactions are in the multi-input multi-output subnetworks. Subnetworks are enriched in multiple GO processes, MSigDB gene sets and motifs. (E) Proportion of shared and different types of cell line-specific interactions. The same color convention is used as in Figure 3C. Comparison of regulatory signals in enhancers that interact in the K562 cell line but not in Hela (top), and similarly interact in K562 but not in Gm12878 (bottom). The blue color represents the presence of a particular signal in that region. The rows are sorted based on the entries in the first column (CTCF) followed by the second columns, etc (using MATLAB's sortrows function). Rows of each column maintain the ordering of the preceding columns.

References

    1. Krijger P.H., de Laat W. Identical cells with different 3D genomes; cause and consequences. Curr. Opin. Genet. Dev. 2013;23:191–196. - PubMed
    1. Rubtsov M.A., Polikanov Y.S., Bondarenko V.A., Wang Y.-H.H., Studitsky V.M. Chromatin structure can strongly facilitate enhancer action over a distance. Proc. Nat. Acad. Sci. U.S.A. 2006;103:17690–17695. - PMC - PubMed
    1. Miele A., Dekker J. Long-range chromosomal interactions and gene regulation. Mol. Biosyst. 2008;4:1046–1057. - PMC - PubMed
    1. de Laat W., Duboule D. Topology of mammalian developmental enhancers and their regulatory landscapes. Nature. 2013;502:499–506. - PubMed
    1. Dekker J., Rippe K., Dekker M., Kleckner N. Capturing Chromosome Conformation. Science. 2002;295:1306–1311. - PubMed

Publication types

LinkOut - more resources