. 2015 Nov;36(11):2170-6.
doi: 10.3174/ajnr.A4428. Epub 2015 Sep 3.

Parametric Response Mapping of Apparent Diffusion Coefficient as an Imaging Biomarker to Distinguish Pseudoprogression from True Tumor Progression in Peptide-Based Vaccine Therapy for Pediatric Diffuse Intrinsic Pontine Glioma

Affiliations

Parametric Response Mapping of Apparent Diffusion Coefficient as an Imaging Biomarker to Distinguish Pseudoprogression from True Tumor Progression in Peptide-Based Vaccine Therapy for Pediatric Diffuse Intrinsic Pontine Glioma

R Ceschin et al. AJNR Am J Neuroradiol. 2015 Nov.

Abstract

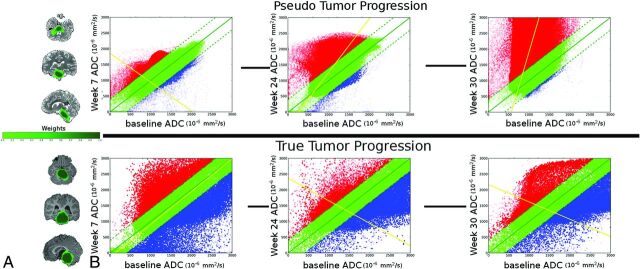
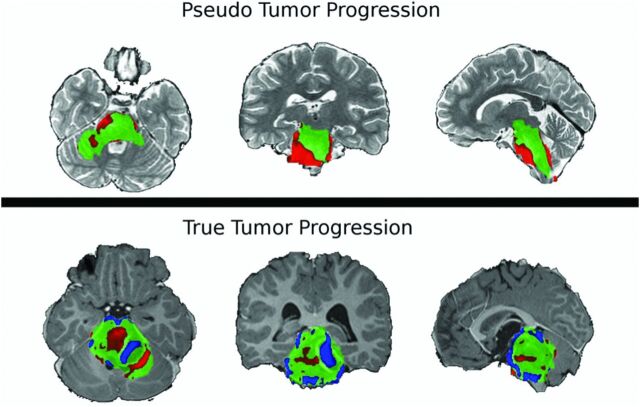
Background and purpose: Immune response to cancer therapy may result in pseudoprogression, which can only be identified retrospectively and may disrupt an effective therapy. This study assesses whether serial parametric response mapping (a voxel-by-voxel method of image analysis also known as functional diffusion mapping) analysis of ADC measurements following peptide-based vaccination may help prospectively distinguish progression from pseudoprogression in pediatric patients with diffuse intrinsic pontine gliomas.

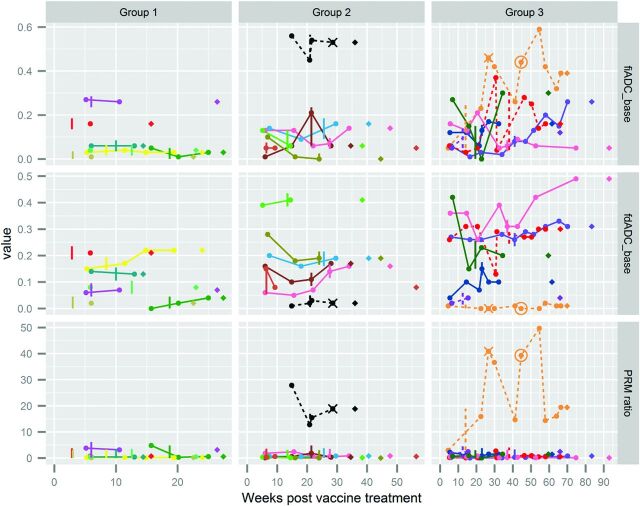
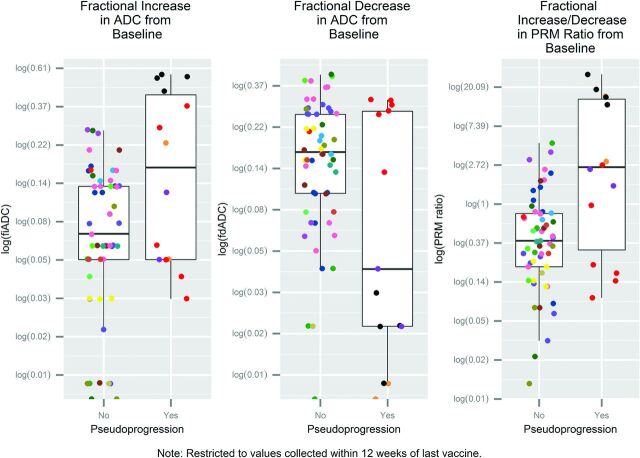
Materials and methods: From 2009 to 2012, 21 children, 4-18 years of age, with diffuse intrinsic pontine gliomas were enrolled in a serial peptide-based vaccination protocol following radiation therapy. DWI was acquired before immunotherapy and at 6-week intervals during vaccine treatment. Pseudoprogression was identified retrospectively on the basis of clinical and radiographic findings, excluding DWI. Parametric response mapping was used to analyze 96 scans, comparing ADC measures at multiple time points (from the first vaccine to up to 12 weeks after the vaccine was halted) with prevaccine baseline values. Log-transformed fractional increased ADC, fractional decreased ADC, and parametric response mapping ratio (fractional increased ADC/fractional decreased ADC) were compared between patients with and without pseudoprogression, by using generalized estimating equations with inverse weighting by cluster size.

Results: Median survival was 13.1 months from diagnosis (range, 6.4-24.9 months). Four of 21 children (19%) were assessed as experiencing pseudoprogression. Patients with pseudoprogression had higher fitted average log-transformed parametric response mapping ratios (P = .01) and fractional decreased ADCs (P = .0004), compared with patients without pseudoprogression.

Conclusions: Serial parametric response mapping of ADC, performed at multiple time points of therapy, may distinguish pseudoprogression from true progression in patients with diffuse intrinsic pontine gliomas treated with peptide-based vaccination.


Figures

Fig 1.
Fig 1.
A, Tumor ROI for a patient with confirmed pseudoprogression (top) and a patient with true tumor progression without pseudoprogression (bottom). The color scale indicates the proportion of scans in which each voxel was classified as tumor tissue (voxel weights). B, Sample serial PRM maps at weeks 7, 24, and 30 compared with the baseline scan before vaccine therapy. Plots show coregistered voxels at baseline compared with the indicated time point. Green voxels indicate no significant change above or below the predefined threshold of ±0.4 mm2/ms. Red voxels show a significant increase in ADC, and blue voxels, a decrease in ADC with time. Point opacity is proportional to the voxel weight (ie, how much does the voxel contribute to the PRM metric calculation in the weighted model).
Fig 2.
Fig 2.
Sample PRM snapshots for a patient with confirmed pseudoprogression (top) and a patient with true tumor progression without pseudoprogression (bottom) give a spatiotemporal reference to tumor characterization. ADC maps are coregistered onto a common space, and voxelwise subtraction is calculated between each subsequent time point and the baseline scan. Green voxels indicate no significant change above or below the predefined threshold of ±0.4 mm2/s. Red voxels show a significant increase in ADC, and blue voxels, a decrease in ADC compared with the baseline. There is evidence of spatial heterogeneity of diffusion within the brain stem tumor of both patients.
Fig 3.
Fig 3.
Serial PRM metric and disease trajectories for 21 pediatric patients with brain stem gliomas. Although the patients were on a treatment trial with scheduled follow-up, imaging time points varied due to scheduling windows and use of DWI. Serial PRM metrics for each patient are shown, with colored lines connecting PRM results for each subject's nonbaseline time points. Columns divide patients into groups by increasing overall survival from the start of vaccine therapy (14–27 weeks, 28–56 weeks, 57–93 weeks). Rows display fractional increased ADC, fractional decreased ADC, and PRMratio compared with the baseline (prevaccine) scan. Each PRM measurement is indicated by a circle, connected by solid lines for patients without pseudoprogression and dashed lines for patients with eventual diagnosis of pseudoprogression. Vertical lines indicate the date of the last vaccine for each patient. For 2 patients with psuedoprogression, vaccine treatment was restarted (date shown as X) 8 and 13 weeks after the initial halt. One of these patients underwent a second treatment stoppage (date shown as a circle). If one examined the time from the last vaccine dose (vertical line or circle for the patient who restarted therapy) to death (♢), patients survived 4–56 weeks after halting vaccine therapy.
Fig 4.
Fig 4.
Boxplots of log-fractional increased ADC [log(fiADC)], log-fractional decreased ADC [log(fdADC)], and log-ratio of fiADC/fdADC [log (PRMratio)]. Values are obtained from PRMs from 75 postbaseline scans no more than 12 weeks after the last vaccine date, each compared with the patient's baseline scan. Cohorts are confirmed pseudoprogression (n = 4 patients) and true tumor progression (no pseudoprogression, n = 17 patients). Data points of the same color are the same patient's PRM metrics for multiple scans, each compared with the baseline. Figure 3 uses the same coloring scheme (but includes time points >12 weeks after last vaccine date).

References

    1. Poussaint TY, Rossi A. Imaging of pediatric brain and spinal cord tumors. In: Hodler J, Schulthess GK. Diseases of the Brain, Head & Neck, Spine 2012–2015: Diagnostic Imaging and Interventional Techniques. New York: Springer-Verlag; 2012:203–14
    1. Jennings MT, Freeman ML, Murray MJ. Strategies in the treatment of diffuse pontine gliomas: the therapeutic role of hyperfractionated radiotherapy and chemotherapy. J Neurooncol 1996;28:207–22 - PubMed
    1. Pollack IF, Jakacki RI, Butterfield LH, et al. Antigen-specific immune responses and clinical outcome after vaccination with glioma-associated antigen peptides and polyinosinic-polycytidylic acid stabilized by lysine and carboxymethylcellulose in children with newly diagnosed malignant brainstem and nonbrainstem gliomas. J Clin Oncol 2014;32:2050–58 10.1200/JCO.2013.54.0526 - DOI - PMC - PubMed
    1. Hygino da Cruz LC Jr, Rodriguez I, Domingues RC, et al. Pseudoprogression and pseudoresponse: imaging challenges in the assessment of posttreatment glioma. AJNR Am J Neuroradiol 2011;32:1978–85 10.3174/ajnr.A2397 - DOI - PMC - PubMed
    1. Bode MK, Ruohonen J, Nieminen MT, et al. Potential of diffusion imaging in brain tumors: a review. Acta Radiol 2006;47:585–94 10.1080/02841850600580598 - DOI - PubMed

Publication types

Substances