. 2015 Nov;89(22):11487-99.
doi: 10.1128/JVI.01887-15. Epub 2015 Sep 2.

Structural Basis of the Inhibition of STAT1 Activity by Sendai Virus C Protein

Affiliations

Structural Basis of the Inhibition of STAT1 Activity by Sendai Virus C Protein

Kosuke Oda et al. J Virol. 2015 Nov.

Abstract

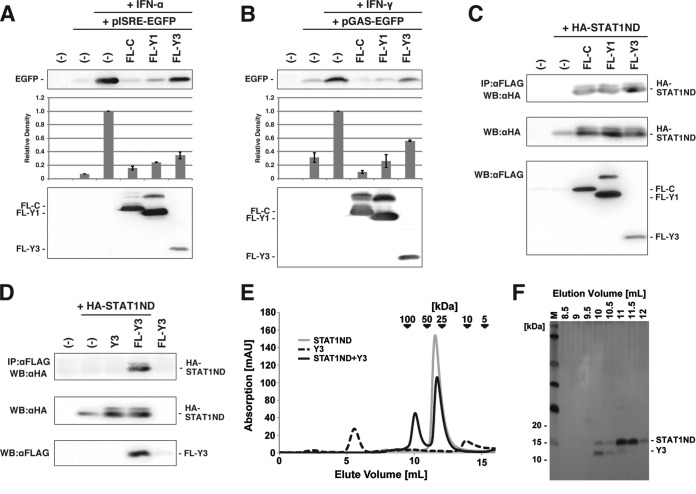
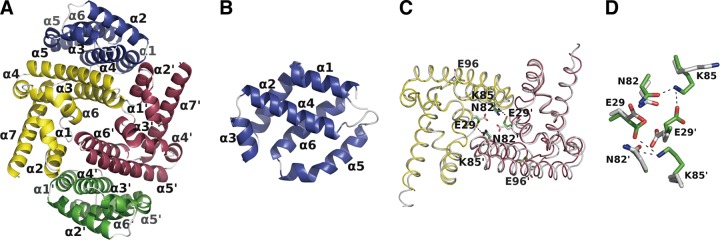
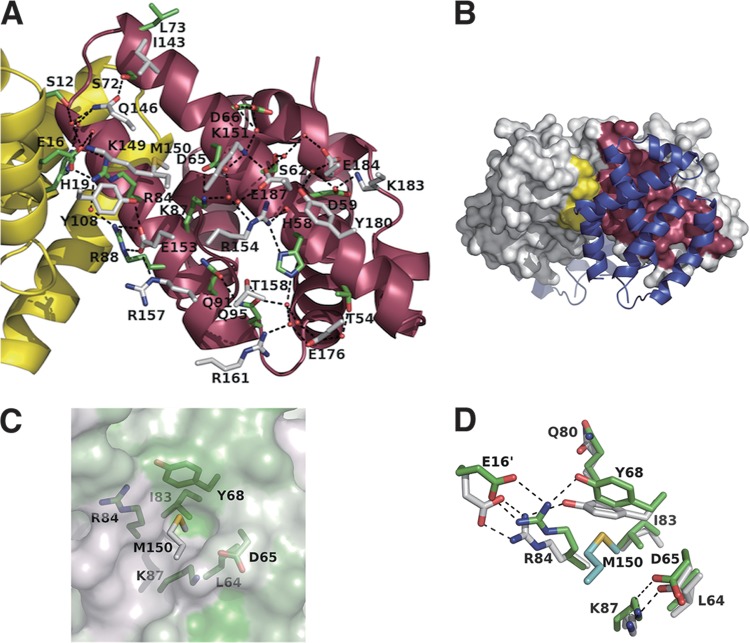
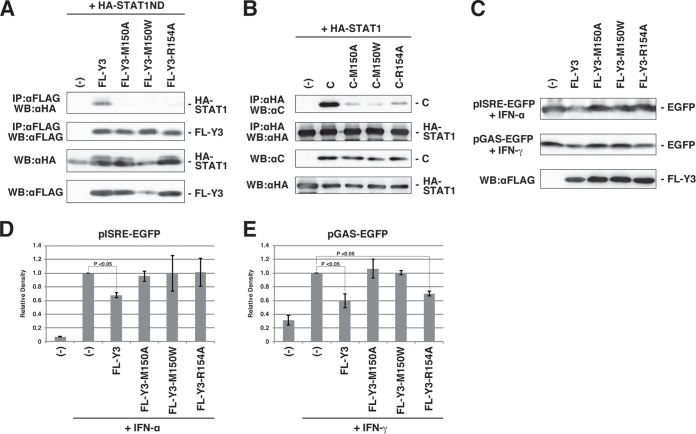
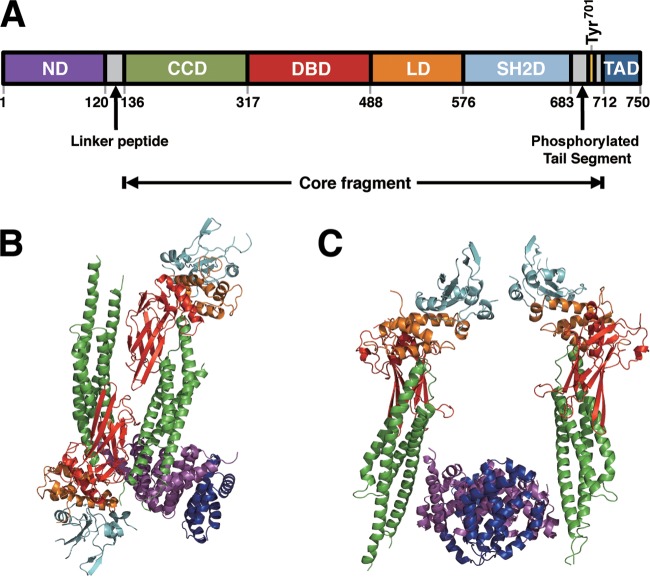
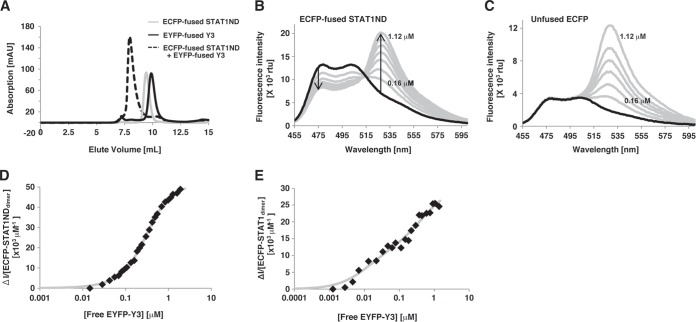
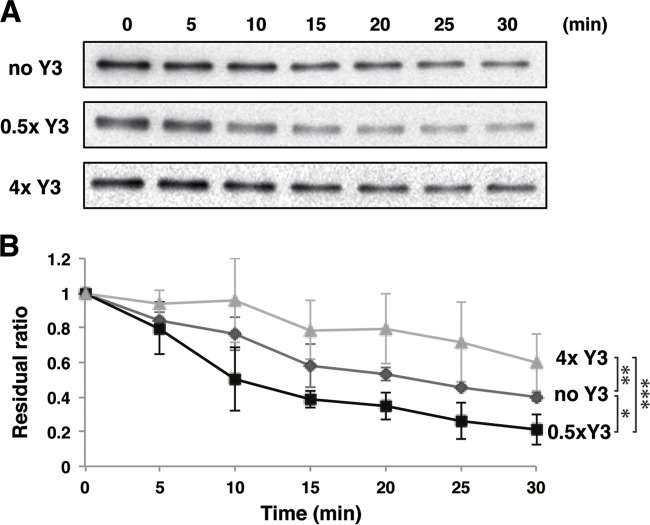
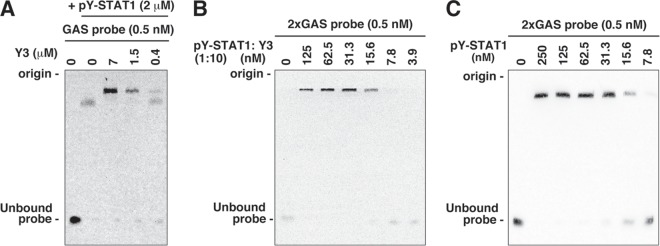
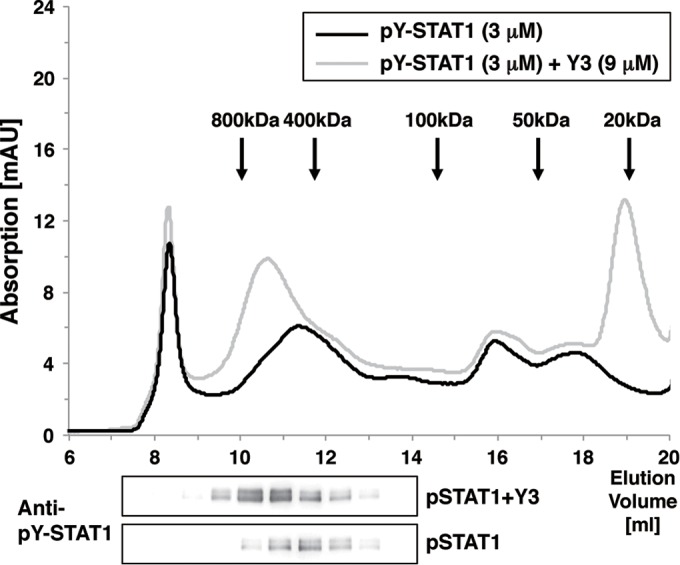
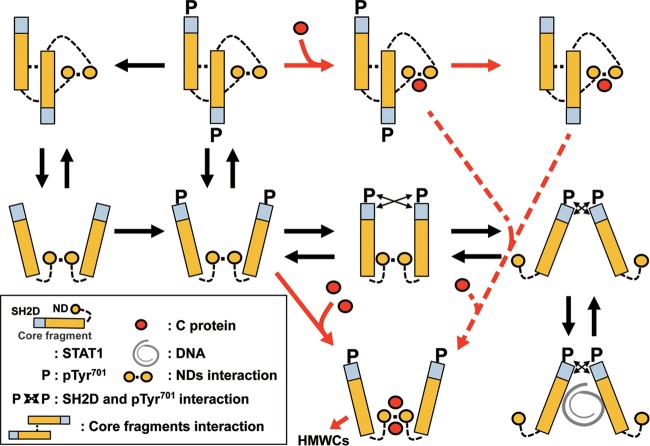
Sendai virus (SeV) C protein inhibits the signal transduction pathways of interferon alpha/beta (IFN-α/β) and IFN-γ by binding to the N-terminal domain of STAT1 (STAT1ND), thereby allowing SeV to escape from host innate immunity. Here we determined the crystal structure of STAT1ND associated with the C-terminal half of the C protein (Y3 [amino acids 99 to 204]) at a resolution of 2.0 Å. This showed that two molecules of Y3 symmetrically bind to each niche created between two molecules of the STAT1ND dimer. Molecular modeling suggested that an antiparallel form of the full-length STAT1 dimer can bind only one Y3 molecule and that a parallel form can bind two Y3 molecules. Affinity analysis demonstrated anticooperative binding of two Y3 molecules with the STAT1 dimer, which is consistent with the hypothetical model that the second Y3 molecule can only target the STAT1 dimer in a parallel form. STAT1 with excess amounts of Y3 was prone to inhibit the dephosphorylation at Tyr(701) by a phosphatase. In an electrophoretic mobility shift assay, tyrosine-phosphorylated STAT1 (pY-STAT1) with Y3 associated with the γ-activated sequence, probably as high-molecular-weight complexes (HMWCs), which may account for partial inhibition of a reporter assay from IFN-γ by Y3. Our study suggests that the full-length C protein interferes with the domain arrangement of the STAT1 dimer, leading to the accumulation of pY-STAT1 and the formation of HMWCs. In addition, we discuss the mechanism by which phosphorylation of STAT2 is inhibited in the presence of the C protein after stimulation by IFN-α/β.

Importance: Sendai virus, a paramyxovirus that causes respiratory diseases in rodents, possesses the C protein, which inhibits the signal transduction pathways of interferon alpha/beta (IFN-α/β) and IFN-γ by binding to the transcription factor STAT1. In virus-infected cells, phosphorylation of STAT1 at the Tyr(701) residue is potently enhanced, although transcription by STAT1 is inert. Here, we determined the crystal structure of the N-terminal domain of STAT1 associated with the C-terminal half of the C protein. Molecular modeling and experiments suggested that the two C proteins bind to and stabilize the parallel form of the STAT1 dimer, which are likely to be phosphorylated at Tyr(701), further inducing high-molecular-weight complex formation and inhibition of transcription by IFN-γ. We also discuss the possible mechanism of inhibition of the IFN-α/β pathways by the C protein. This is the first structural report of the C protein, suggesting a mechanism of evasion of the paramyxovirus from innate immunity.


Figures

FIG 1
FIG 1
Suppression of signal transduction from IFN-α/β and IFN-γ by Y3 and complex formation of Y3 with STAT1ND. (A) For IFN-α/β signal transduction analysis, subconfluent 293T cells were transfected with pISRE-EGFP and an expression plasmid for FL-C, FL-Y1, FL-Y3, or no protein (−), and IFN-α (20 U/ml) was included in the culture medium after 6 h. At 24 h posttransfection, cells were processed for Western blotting using an anti-GFP antibody. A gel image and quantified graph from three independent experiments are shown. The error bar indicates the standard deviation. (B) For IFN-γ signal transduction analysis, reporter plasmids pGAS-EGFP and IFN-γ (250 U/ml) were used instead of pISRE-EGFP and IFN-α, respectively. Cells were analyzed as described in panel A. (C and D) 293T cells were transfected with the indicated plasmids and solubilized in cell lysis buffer after 24 h. Cell lysates were immunoprecipitated (IP) with an anti-FLAG antibody (αFLAG) together with protein G Sepharose, and the immunoprecipitates were analyzed by SDS-PAGE followed by Western blotting (WB) using an anti-HA antibody (αHA). A part of the cell lysates was processed for SDS-PAGE and Western blotting to confirm protein expression using the anti-HA antibody and anti-FLAG antibody. (E) Analytical size exclusion chromatograms of Y3 (dotted line) and STAT1ND in the presence (black line) or absence (gray line) of Y3. (F) Fractions eluted from the size exclusion chromatogram for STAT1ND with Y3 in panel E were analyzed using SDS-PAGE and silver staining.
FIG 2
FIG 2
Crystal structure of the Y3:STAT1ND complex and comparison between Y3-bound and Y3-free STAT1ND dimers. (A) The tetrameric structure of two STAT1ND and two Y3 molecules is shown in a ribbon representation. Each structure of Y3 is colored in blue and green, respectively, and each subunit of the STAT1ND dimer is colored in yellow and magenta, respectively. All of the structural diagrams presented in this article were made by using PyMOL (38). (B) Structure of a Y3 monomer derived from panel A with a distinct view angle to show each α-helix separately. (C) Superimposed structures of Y3-bound and Y3-free STAT1ND dimers. Each subunit of the Y3-bound STAT1ND dimer is colored in yellow and in magenta, respectively, and two subunits of the Y3-free STAT1ND dimer are shown in white. The Cα atoms of one subunit (shown in yellow) of the Y3-bound STAT1ND dimer were maximally fitted to those of one subunit of the Y3-free STAT1ND dimer. Carbon atoms of E29, N82, K85, and E96 from Y3-bound STAT1ND shown in the stick diagram are colored in green, and those from Y3-free STAT1ND shown in the stick diagram are colored in white. The direction of the view is the same as that in panel A. (D) An enlarged view of panel C centered on the dimer interface is shown. The dotted lines represent hydrogen bonds.
FIG 3
FIG 3
Binding interface between STAT1ND and Y3. (A) Each subunit of the STAT1ND dimer shown in the ribbon representation is colored as in Fig. 2. Carbon atoms shown in the stick diagram from STAT1ND and Y3 are colored in green and white, respectively. Water molecules are shown as red spheres. (B) The contact area between one subunit of the STAT1ND dimer and Y3 and that between the other subunit and Y3 on the molecular surface are shown in yellow and magenta, respectively. Y3 is colored in blue. The direction of the view is the same as that in panel A. (C) The molecular surface of the STAT1ND dimer is shown with its hydrophobic property colored in green. The L64, D65, Y68, I83, R84, and K87 residues of STAT1ND (green) and the M150 residue of Y3 (white) are shown in the stick diagram. The direction of the view is almost similar to that of the view in panel A. (D) Structure around the pocket created on the STAT1ND molecular surface. Carbon atoms from the Y3-bound STAT1ND dimer are colored in green, and those from the Y3-free STAT1ND dimer are colored in white. Carbon atoms from Y3 are colored in cyan. The direction of the view is the same as that in panel A.
FIG 4
FIG 4
Effects of the M150 and R154 residues of the C protein on binding with STAT1. (A and B) 293T cells were transfected with the indicated plasmids and solubilized in cell lysis buffer after 24 h. Cell lysates were immunoprecipitated with an anti-FLAG (A) or anti-HA (B) antibody together with protein G Sepharose, and the immunoprecipitates were analyzed by SDS-PAGE followed by Western blotting using an anti-HA (A) or anti-C (B) antibody. A part of the cell lysates was processed for SDS-PAGE and Western blotting to confirm protein expression using anti-HA, anti-FLAG, and anti-C antibodies. (C) Accumulated EGFP expressed from pISRE-EGFP or pGAS-EGFP reporter plasmid after addition of IFN-α or IFN-γ was shown by Western blotting in the presence of FL-Y3 protein mutants, as indicated in the figure. Expression of FL-Y3 protein mutants in one experiment was also shown. (D and E) The experiments were repeated at least three times, and band signals of accumulated EGFP were quantified with the MultiGauge software. The average values were plotted on the graph, and the error bar indicates the standard deviation. The P value was calculated on the basis of the Mann-Whitney U test.
FIG 5
FIG 5
Structure of STAT1 and predicted models of Y3-bound STAT1. (A) Linear representation of the domains of human STAT1. ND, N-terminal domain; CCD, coiled-coil domain; DBD, DNA-binding domain; LD, linker domain; SH2D, SH2 domain; TAD, transcription activation domain. (B and C) A STAT1(1–683) dimer taking an antiparallel form associated with one Y3 molecule (B) and one taking a parallel form associated with two Y3 molecules are modeled. Each domain in the STAT1 structure is colored corresponding to that in panel A, and Y3 is colored in blue. These crystal structures were generated as shaded ribbons using coordinates from the Protein Data Bank. (The PDB accession number for the unphosphorylated STAT1 dimer is 1YVL).
FIG 6
FIG 6
Affinity analysis. (A) Analytical-exclusion chromatograms of ECFP-fused STAT1ND (gray line) and EYFP-fused Y3 (black line). The broken line shows a 1:1 mixture of ECFP-fused STAT1ND and EYFP-fused Y3. A 15 μM concentration of ECFP-fused STAT1ND was preincubated with or without an equimolar concentration of EYFP-fused Y3 for 10 min, followed by gel filtration chromatography using a Superdex 75 10/300 GL high-performance liquid chromatography (HPLC) column. (B and C) Fluorescence emission spectra by direct titration to 0.2 μM ECFP-fused STAT1ND (B) or 0.05 μM unfused ECFP (C) with EYFP-fused Y3 at 0.16, 0.32, 0.48, 0.64, 0.80, 0.96, and 1.12 μM (gray line). Two arrows represent decreased fluorescence intensity at 475 nm and increased fluorescence intensity at 527 nm. rfu, relative fluorescence units. (D and E) The quenched fluorescence intensities (ΔI) of ECFP-fused STAT1ND (D) or STAT1(1–713) (E) at 475 nm caused by the addition of EYFP-fused Y3 are divided by the concentration of each STAT1 dimer. The values are then plotted against the concentration of free EYFP-fused Y3. The gray curves drawn represent the best fits to the data.
FIG 7
FIG 7
In vitro dephosphorylation assay of pY-STAT1 with a given concentration of Y3. Dephosphorylation rates of pY-STAT1(1–713) catalyzed by TC45 were measured under the condition of a high concentration of Y3 (a 4-fold-higher concentration than that of pY-STAT1 [▲]), a low concentration of Y3 (half of that of pY-STAT1 [■]), and the absence of Y3 (◆). The residual ratio is the ratio of band signals for pY-STAT1(1–713) at various time points to that at 0 min determined by Western blotting. Statistical significance was evaluated with the Student t test based on the values at 30 min. *, P < 0.05; **, P < 0.01; ***, P < 0.005.
FIG 8
FIG 8
Electrophoretic mobility shift assay. (A) pY-STAT1(1–713) and a given concentration of Y3 were incubated, followed by the addition of a 0.5 nM concentration of a biotin-labeled DNA probe containing a single GAS element. Protein-DNA complexes were resolved on a 6% nondenaturing polyacrylamide gel and transferred onto a nylon membrane. The biotin-labeled probe was detected by using a LightShift chemiluminescent EMSA kit. The positions of the electrophoretic origin and unbound probe are shown. (B and C) Two tandem GAS elements (2×GAS probe) and a given concentration of pY-STAT1(1–713) and Y3 (molar ratio of 1:10) (B) or pY-STAT1(1–713) alone (C) was incubated and analyzed as in panel A to compare the affinities of pY-STAT1 with the GAS element in the presence of different concentrations of Y3.
FIG 9
FIG 9
Oligomeric analysis of pY-STAT1 with or without Y3. pY-STAT1(1–713) (3 μM) was preincubated with or without 9 μM Y3 for 10 min. A portion of the solution was injected into a Superdex 200 10/300 GL HPLC column equilibrated with 0.1 M Tris-HCl buffer (pH 8.0) containing 100 mM NaCl at room temperature at a flow rate of 0.7 ml/min. The pY-STAT1 contained in each fraction was resolved by SDS-PAGE and detected by using an anti-pY-STAT1 antibody.
FIG 10
FIG 10
Transition of the domain arrangement of the STAT1 dimer in the presence of C protein. Structural models of the STAT1 dimer are shown, and the components of STAT1 are indicated in the inset. The transition of the STAT1 dimer by the C protein is shown by a red arrow, and inefficient transition from a one-C-bound form to a two-C-bound form is shown by a red dotted arrow.

Similar articles

Cited by

References

    1. Lamb RA, Parks GD. 2013. Paramyxoviridae: the viruses and their replication, p 957–995. In Knipe DM, Howley PM (ed), Fields virology, 6th ed, vol 1 Lippincott Williams & Wilkins, Philadelphia, PA.
    1. Nagai Y, Takakura A, Irie T, Yonemitsu Y, Gotoh B. 2011. Sendai virus: evolution from mouse pathogen to a state-of-the-art tool in virus research and biotechnology, p 115–173. In Samal SK. (ed), The biology of paramyxoviruses. Caister Academic Press, Norfolk, United Kingdom.
    1. Irie T, Nagata N, Igarashi T, Okamoto I, Sakaguchi T. 2010. Conserved charged amino acids within Sendai virus C protein play multiple roles in the evasion of innate immune responses. PLoS One 5:e10719. doi:10.1371/journal.pone.0010719. - DOI - PMC - PubMed
    1. Komatsu T, Takeuchi K, Yokoo J, Gotoh B. 2004. C and V proteins of Sendai virus target signaling pathways leading to IRF-3 activation for the negative regulation of interferon-beta production. Virology 325:137–148. doi:10.1016/j.virol.2004.04.025. - DOI - PubMed
    1. Takeuchi K, Komatsu T, Kitagawa Y, Sada K, Gotoh B. 2008. Sendai virus C protein plays a role in restricting PKR activation by limiting the generation of intracellular double-stranded RNA. J Virol 82:10102–10110. doi:10.1128/JVI.00599-08. - DOI - PMC - PubMed

Publication types

MeSH terms