. 2015 Nov;89(22):11294-311.
doi: 10.1128/JVI.00946-15. Epub 2015 Sep 2.

Phenotypic Correlates of HIV-1 Macrophage Tropism

Affiliations

Phenotypic Correlates of HIV-1 Macrophage Tropism

Kathryn T Arrildt et al. J Virol. 2015 Nov.

Abstract

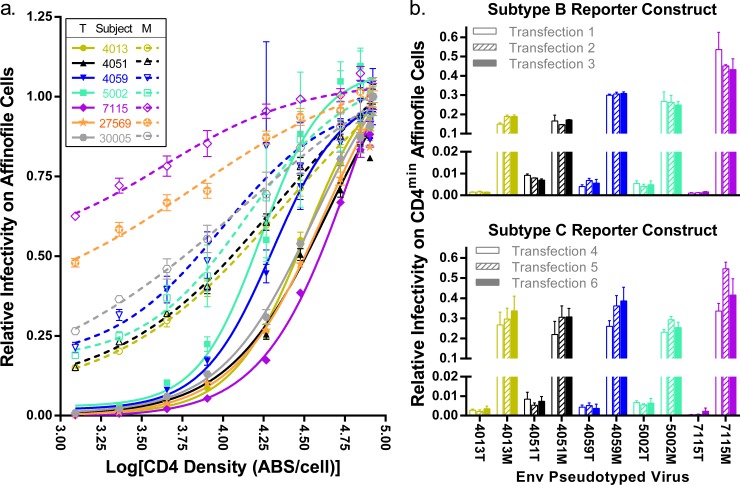
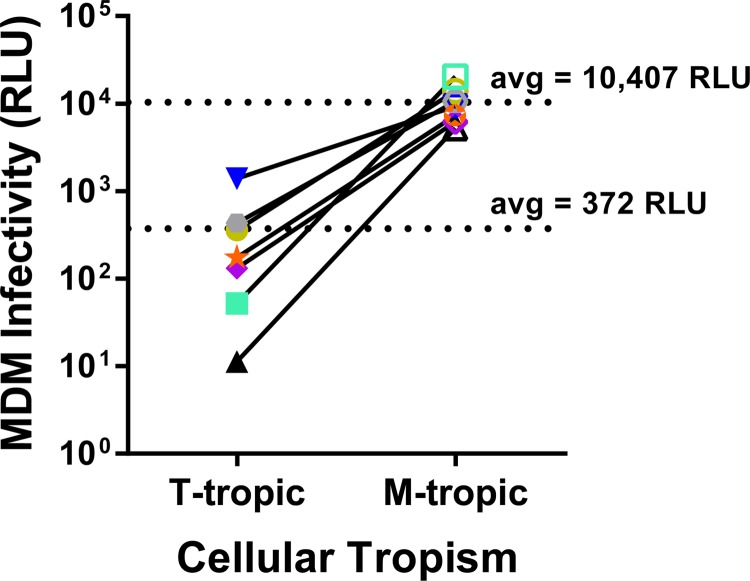
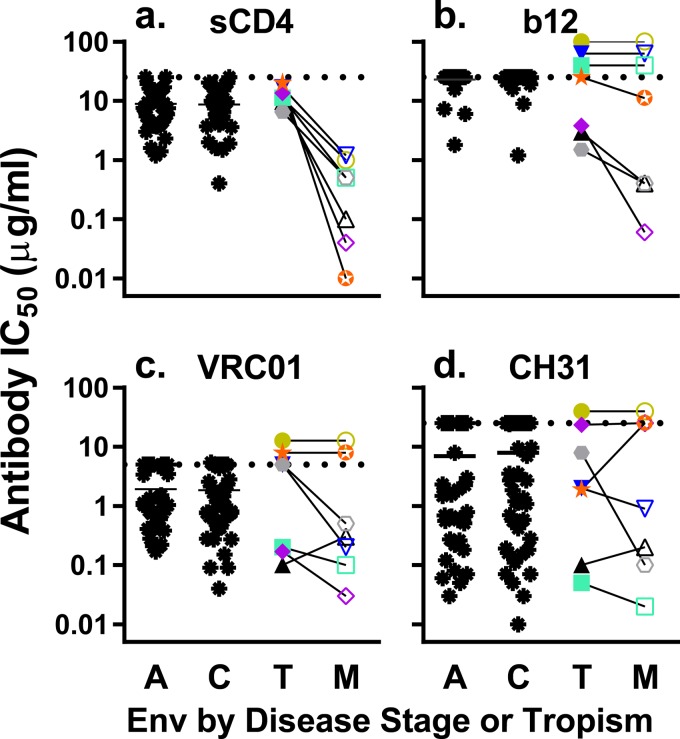
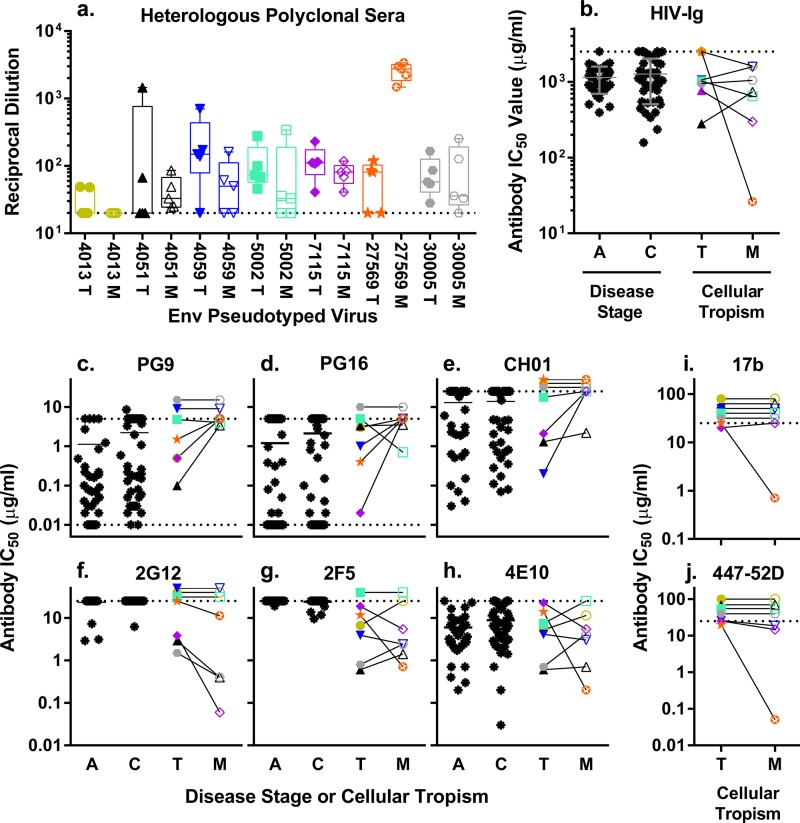
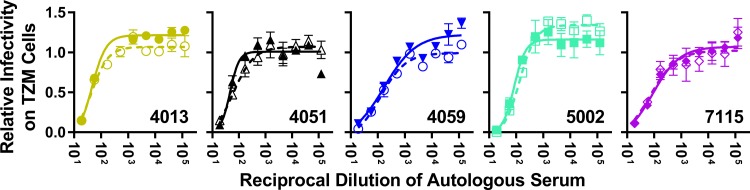
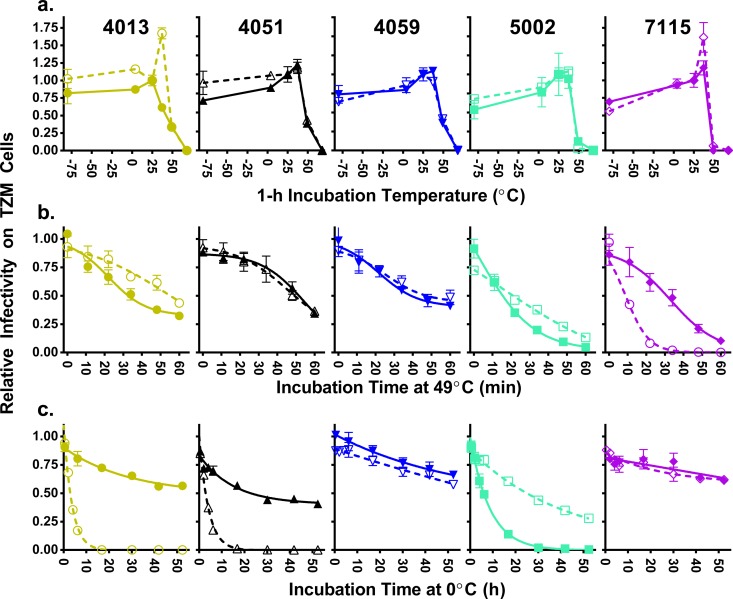
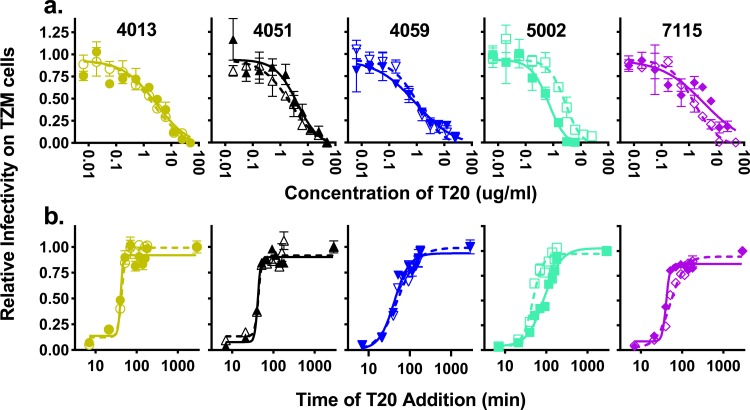
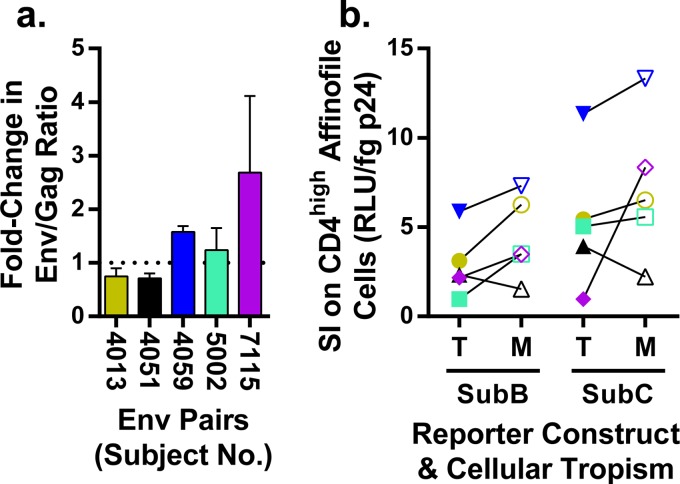
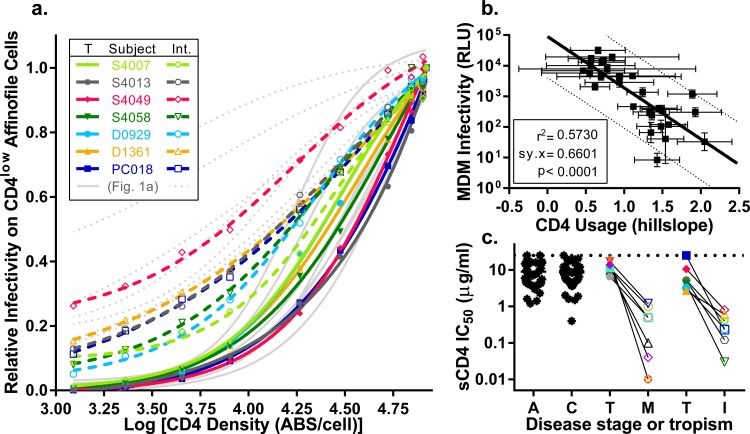
HIV-1 is typically CCR5 using (R5) and T cell tropic (T-tropic), targeting memory CD4(+) T cells throughout acute and chronic infections. However, viruses can expand into alternative cells types. Macrophage-tropic (M-tropic) HIV-1 variants have evolved to infect macrophages, which have only low levels of surface CD4. Most M-tropic variants have been isolated from the central nervous system during late-stage chronic infection. We used the HIV-1 env genes of well-defined, subject-matched M-tropic and T-tropic viruses to characterize the phenotypic features of the M-tropic Env protein. We found that, compared to T-tropic viruses, M-tropic viruses infect monocyte-derived macrophages (MDMs) on average 28-fold more efficiently, use low-density CD4 more efficiently, have increased sensitivity to soluble CD4 (sCD4), and show trends toward sensitivity to some CD4 binding site antibodies but no difference in sensitivity to antibodies targeting the CD4-bound conformation. M-tropic viruses also displayed a trend toward resistance to neutralization by monoclonal antibodies targeting the V1/V2 region of Env, suggesting subtle changes in Env protein conformation. The paired M- and T-tropic viruses did not differ in autologous serum neutralization, temperature sensitivity, entry kinetics, intrinsic infectivity, or Env protein incorporation. We also examined viruses with modestly increased CD4 usage. These variants have significant sensitivity to sCD4 and may represent evolutionary intermediates. CD4 usage is strongly correlated with infectivity of MDMs over a wide range of CD4 entry phenotypes. These data suggest that emergence of M-tropic HIV-1 includes multiple steps in which a phenotype of increased sensitivity to sCD4 and enhanced CD4 usage accompany subtle changes in Env conformation.

Importance: HIV-1 typically replicates in CD4(+) T cells. However, HIV-1 can evolve to infect macrophages, especially within the brain. Understanding how CCR5-using macrophage-tropic viruses evolve and differ from CCR5-using T cell-tropic viruses may provide insights into viral evolution and pathogenesis within the central nervous system. We characterized the HIV-1 env viral entry gene from subject-matched macrophage-tropic and T cell-tropic viruses to identify entry features of macrophage-tropic viruses. We observed several differences between T cell-tropic and macrophage-tropic Env proteins, including functional differences with host CD4 receptor engagement and possible changes in the CD4 binding site and V1/V2 region. We also identified viruses with phenotypes between that of "true" macrophage-tropic and T cell-tropic viruses, which may represent evolutionary intermediates in a multistep process to macrophage tropism.


Figures

FIG 1
FIG 1
Increased CD4 usage differentiates M-tropic viruses from T-tropic viruses. (a) Paired T-tropic and M-tropic env genes were used to pseudotype luciferase reporter viruses. These paired viruses were then used to infect Affinofile cells expressing various levels of CD4, and infectivity was measured by the relative light units (RLU) produced by luciferase. CD4 densities were measured by flow cytometry and reported as the log10 value of antibody binding sites (ABS) per cell. Infectivity is normalized to infectivity at the maximum induction of CD4 and fitted to a dose-response curve, which represents the CD4 usage of each virus and can be described using the Hill slopes and EC50s. Viruses expressing T-tropic Env proteins (T) are represented with closed symbols and solid lines. Viruses expressing M-tropic Env proteins (M) are represented with open symbols and broken lines. Unique color and shape combinations (as specified in the legend within the figure) identify the subjects from which the env genes were isolated, and these identifiers are maintained for all of the figures. M-tropic Env proteins effected a 62-fold increase in average entry at the lowest density of CD4 over subject-matched T-tropic Env proteins (tpaired = 4.2, df = 6, P value = 0.006). M-tropic Env proteins also had enhanced CD4 usage over the entire range of CD4 densities as described by a 2.7-fold-lower EC50 (tpaired = 3.1, df = 6, P value = 0.02) and a 1.8-fold-lower Hill slope (tpaired = 10, df = 6, P value < 0.0001) compared to subject-matched T-tropic Env proteins. (b) Five pairs of T-tropic and M-tropic env genes were pseudotyped in triplicate with either a subtype B (top, transfections 1 to 3) or subtype C (bottom, transfections 4 to 6) env-deficient HIV-1 genome containing a firefly (subtype B) or Renilla (subtype C) luciferase reporter gene. The resulting 60 pseudoviruses (10 env vectors × 2 reporter vectors × 3 replicates) were used to infect CD4low Affinofiles, and infectivity was reported as a fraction of infectivity on CD4high Affinofiles (infected concurrently). The average standard deviation (SD) across transfections for viruses pseudotyped with the subtype B construct is 1.1% (a range of 0.012% to 5.5%) and with the subtype C construct is 2.9% (a range of 0.061% to 11%). There were minor differences in the relative infectivity of viruses produced with the subtype B reporter versus that produced with the subtype C reporter (SD of differences = 5.4%), but these differences were not statistically significant (tpaired = 1.4, df = 9, P value = 0.21).
FIG 2
FIG 2
M-tropic viruses are better adapted than T-tropic viruses to infection of MDMs. Paired T-tropic and M-tropic pseudotyped reporter viruses were used to infect monocyte-derived macrophages (MDMs) isolated from four donors. Infectivity on MDMs was normalized to infectivity on Affinofile cells expressing maximum CD4 levels. Normalized infectivity values were averaged across donors for each virus and plotted. Closed symbols represent T-tropic Env proteins (T), and open symbols represent M-tropic Env proteins (M) with links between subject-matched pairs. Colors and symbol shapes identify the originating subject as detailed in Fig. 1. Comparing the mean infectivities of T-tropic and M-tropic viruses revealed that M-tropic Env proteins confer a 28-fold increase in the average MDM infectivity over subject-matched T-tropic Env proteins. Mean values are listed and marked with broken lines. The log normalized values were compared between T-tropic and M-tropic infectivities by paired t test (tpaired = 7.0, df = 6, P value = 0.0004).
FIG 3
FIG 3
M-tropic viruses are significantly more sensitive to neutralization by sCD4 and show trends toward increased sensitivity to some CD4bs-targeting antibodies compared to paired T-tropic viruses. Pseudotyped reporter viruses were exposed to various concentrations of sCD4 (a) or an antibody with an epitope overlapping the CD4 binding site (CD4bs) b12 (b), VRCO1 (c), or CH31 (d) in a TZM-bl neutralization assay. IC50s were calculated from dose-response curves and plotted. Dashed lines represent the limits of detection. IC50s above the limit of detection (LOD) were plotted at the LOD, except for pairs where both viruses had IC50s that exceeded the LOD, in which case the symbols were stacked above the LOD line. The same Env-pseudotyped viruses were used in each panel: a control group of T-tropic acute (A) and chronic (C) infection viruses (black asterisks) and our panel of matched T-tropic viruses (closed symbols) and M-tropic viruses (open symbols) from seven subjects. The data for the acute and chronic subtype C viruses are reproduced from Ping et al. (3) to allow a comparison to a large data set of typical viral Env proteins. Viruses expressing M-tropic Env proteins had a statistically significant 27-fold increase in sensitivity to neutralization by sCD4 over subject-matched T-tropic Env proteins (statistical analysis performed on log normalized EC50s; tpaired = 5.5, df = 6, P value = 0.002). M-tropic Env proteins showed trends toward sensitivity to neutralization by b12 (Wpaired = 10, P value = 0.1) and VRC01 (Wpaired = 10, P value = 0.3) over subject-matched T-tropic Env proteins that did not reach statistical significance using a Wilcoxon matched-pair test. No difference in sensitivity to neutralization by CH31 was observed (Wpaired = −3, P value = 0.8).
FIG 4
FIG 4
Similar to T-tropic viruses, M-tropic viruses are generally resistant to neutralization by non-CD4bs-targeting antibodies with subtle trends toward increased resistance to V1/V2-targeting antibodies and decreased resistance to a glycan-targeting antibody. Pseudotyped reporter viruses were exposed to various concentrations of the following in a TZM-bl neutralization assay: polyclonal sera from five HIV-infected subjects (a); purified polyclonal HIV-Ig (b); anti-V1/V2 MAbs PG9 (c), PG16 (d), and CH01 (e); antiglycosylation MAb 2G12 (f); anti-MPER MAbs 2F5 (g), and 4E10 (h); and anti-CD4i MAbs 17b (i) and 447-52D (j). The data for the acute and chronic infection subtype C viruses are reproduced from Ping et al. (3) to allow a comparison to a large data set of typical viral Env proteins. IC50s were calculated from dose-response curves and plotted. Dashed lines represent the limits of detection. IC50s above the limit of detection (LOD) were plotted at the LOD, except for pairs where both viruses had IC50s that exceeded the LOD, in which case the symbols were stacked above the LOD line. Data for the same Env-pseudotyped viruses were used in each panel: T-tropic acute (A) and chronic (C) infection viruses (black asterisks; panels b to h only), T-tropic viruses (T; closed symbols), and M-tropic viruses (M; open symbols). Subject-matched viruses are linked, and the IC50s of T-tropic and M-tropic viruses were compared using a Wilcoxon matched-pair test. M-tropic and subject-matched T-tropic Env proteins were not significantly different in neutralization by polyclonal sera (FANOVA = 0.8 [where ANOVA is analysis of variance], r2 = 0.1, P value = 0.6) (a) or HIV-Ig (Wpaired = 12, P value = 0.5) (b) or by MPER-targeting MAbs 2F5 (Wpaired = 1, P value = 1) (g) and 4E10 (Wpaired = −2, P value = 0.9) (h). M-tropic Env proteins trended toward increased resistance to neutralization by V1/V2-targeting MAbs PG9 (Wpaired = −13, P value = 0.1) (c), PG16 (Wpaired = −13, P value = 0.2) (d), and CH01 (Wpaired = −10, P value = 0.1) (e) and increased sensitivity to neutralization by glycosylation-targeting MAb 2G12 (Wpaired = 10, P value = 0.1) (h) compared to subject-matched T-tropic Env proteins. Thirteen of the 14 viruses were resistant to neutralization by MAbs 17b (i) and 447-52D (j), which target epitopes typically present only in the CD4-bound conformation of the viral Env protein from primary isolates (for 17b, Wpaired = 1, P value = 1; for 447-52D, Wpaired = 6, P value = 0.3).
FIG 5
FIG 5
M-tropic viruses have not evolved an increased sensitivity to autologous serum. Five paired T-tropic (closed symbols, solid lines) and M-tropic (open symbols, broken lines) pseudoviruses were exposed to heat-inactivated autologous serum (from the same subject and sampling time as the viruses isolated) in a TZM-bl neutralization assay. The relative infectivity was analyzed as a function of the reciprocal dilution of the autologous serum. No detectable differences in sensitivity to autologous serum were detected between paired T-tropic and M-tropic viruses (Wpaired = −1.0, P value = 1.0). The average IC50 across subjects and tropism is 1:100, with a range from 1:48 to 1:200 (SD = 1:50, standard error of the mean [SEM] = 1:16).
FIG 6
FIG 6
M-tropic viruses do not differ from T-tropic viruses in sensitivity to temperature. The effect of temperature on infectivity was assessed for five pairs of subject-matched T-tropic (closed symbols, solid lines) and M-tropic (open symbols, broken lines) Env-pseudotyped reporter viruses. (a) Viruses were incubated at various temperatures for 1 h prior to infecting TZM-bl cells, and the remaining infectivity was normalized to infectivity after incubation at 25°C. Viruses with M-tropic Env proteins were compared with subject-matched T-tropic Env proteins at five temperatures (−80°C, 4°C, 37°C, 49°C and 68°C) but revealed no significant differences between tropism groups (at −80°C, Wpaired = −3, P value = 0.8; at 4°C, Wpaired = −5, P value = 0.6; at 37°C, Wpaired = −7, P value = 0.4; at 49°C, Wpaired = −1, P value = 1; at 68°C, Wpaired = −1, P value = 1). Viruses were incubated at 49°C (b) or 0°C (c) for various lengths of time prior to infecting TZM-bl cells. The remaining infectivity was normalized to an untreated aliquot of each virus. M-tropic Env proteins differed in some cases from paired T-tropic Env proteins, but these differences were not correlated with tropism (panel b, Wpaired = 7, P value = 0.4; panel c, Wpaired = 3, P value = 0.8).
FIG 7
FIG 7
M-tropic viruses have fusion kinetics similar to those of T-tropic viruses. Inhibition assays with T20 were performed on five pairs of subject-matched T-tropic (closed symbols, solid lines) and M-tropic (open symbols, broken lines) Env-pseudotyped reporter viruses. (a) Viruses were exposed to different concentrations of T20 prior to infecting TZM-bl cells, and the remaining infectivity was normalized to untreated virus. T20 dose-response curves did not differ detectably between matched pairs (Wpaired = 9, P value = 0.3) and were similar across subjects. (b) A saturating concentration (50 μg/ml) of T20 was added to viruses at various times after the addition of cells. Resistance to T20 over time was plotted as a normalized value of remaining infectivity. The resulting measures of fusion kinetics did not differ detectably between matched pairs (Wpaired = −5, P value = 0.6) and were similar across subjects.
FIG 8
FIG 8
M-tropic Env proteins are incorporated at levels similar to those of T-tropic Env proteins. (a) Western blot analysis was used to evaluate the relative incorporation of Env proteins into virions using five pairs of T-tropic and M-tropic Env-pseudotyped viruses. For each virus, the abundance of Env protein was detected by Western blotting normalized to the abundance of Gag. The normalized values of Env proteins in M-tropic viruses were compared to those of subject-matched T-tropic viruses and reported as the fold change value of M-tropic over T-tropic Env protein incorporation. The fold change values (mean = 1.4, SD = 0.8) were not found to deviate significantly from a hypothetical mean of 1 (tpaired = 1, df = 4, P value = 0.3), which represents the null hypothesis of an equal abundance of Env proteins on the surface of viruses expressing T-tropic and M-tropic Env proteins. (b) Five paired T-tropic (T, closed symbols) and M-tropic (M, open symbols) env genes were pseudotyped with an env-deficient HIV-1 genome that was either subtype B with a firefly luciferase reporter gene (SubB) or subtype C with a Renilla luciferase reporter gene (SubC). Virion density was represented by p24 concentration and the titers of infectivity were determined on CD4high Affinofile cells. The specific infectivity (SI) values reported are the linear relationship of infectivity (RLU) per virion as represented by a structural protein product, p24-Gag (fg). Although the subtype C construct gives overall higher SI values, the effects of HIV-1 subtypes cannot be directly compared, because different reporters are used. Despite a small apparent trend of increased SI of M-tropic viruses in both reporter constructs, any differences in SI between paired T-tropic and M-tropic viruses are not significant when taken together (Wpaired = 13, P value = 0.13) or separated by reporter construct (for SubB, Wpaired = 13, P value = 0.13; for SubC, Wpaired = 9, P value = 0.31). Also, because the CD4 density on CD4high Affinofiles is saturating for M-tropic viruses and not saturating for T-tropic viruses, the SI values for T-tropic viruses are likely an underestimate, which may account for a slight reduction in the observed SI for T-tropic viruses compared to that for M-tropic viruses.
FIG 9
FIG 9
Viruses of intermediate CD4 usage reveal a correlation between CD4 usage and MDM infectivity. Seven pairs of subject-matched Env-pseudotyped viruses in which one virus had a modest enhancement in entry of CD4low Affinofile cells (intermediate, Int.) and the other virus was T-tropic (T) were analyzed and plotted, and the data were overlapped for the original seven pairs of M-tropic (M) and T-tropic (T) viruses shown in Fig. 1. (a) CD4 usage of intermediate (open symbols, broken lines) and T-tropic (closed symbols, solid lines) viruses was evaluated by the Affinofile cell assay as previously described and plotted against previously shown data for subject-matched T-tropic (solid light gray lines) and M-tropic (dotted light gray lines) viruses from Fig. 1. Unique colors are used to identify each subject as specified in the figure legend (the overlap in symbols with those from Fig. 1 is not meaningful). The intermediate viruses differ from paired T-tropic viruses in Hill slope (tpaired = 2.9, df = 6, P value = 0.03) but not in EC50 (tpaired = 1.0, df = 6, P value = 0.34). Similarly, intermediate viruses also differ from unpaired M-tropic viruses, but only in EC50 (tpaired = 2.5, df = 12, P value = 0.03) and not Hill slope (tpaired = 0.09, df = 12, P value = 0.93). (b) CD4 usage was represented by Hill slope values for each virus, which was plotted against log normalized values of infectivity on MDMs. We evaluated the correlation of CD4 usage and MDM infection and plotted the linear regression (solid line) with the 95% confidence band (broken lines). Variation in CD4 usage could explain 57% of the variation in MDM infectivity (r2 = 0.57, Sy.x = 0.66 [where Sy.x is residual standard deviation], P value < 0.0001). (c) Neutralization sensitivity to sCD4 was evaluated in a TZM-bl neutralization assay as previously described and reported as IC50s. Subject-matched pairs of intermediate (Int., open symbols) and T-tropic (T, closed symbols) viruses were plotted against data from Fig. 3a for subject-matched pairs of T-tropic (T, closed symbols) and M-tropic (M, open symbols) viruses and the panel of viruses from acute (A) and chronic (C) infections (black asterisks). The colors and symbols are the same as those identified in Fig. 1a and 9a. Subject-matched viruses are linked. Similar to M-tropic Env proteins, Int. Env proteins are 23-fold more sensitive to neutralization by sCD4 than subject-matched T-tropic Env proteins (tpaired = 6.8, df = 6, P value = 0.0005).

References

    1. Isaacman-Beck J, Hermann EA, Yi Y, Ratcliffe SJ, Mulenga J, Allen S, Hunter E, Derdeyn CA, Collman RG. 2009. Heterosexual transmission of human immunodeficiency virus type 1 subtype C: macrophage tropism, alternative coreceptor use, and the molecular anatomy of CCR5 utilization. J Virol 83:8208–8220. doi:10.1128/JVI.00296-09. - DOI - PMC - PubMed
    1. Li M, Salazar-Gonzalez JF, Derdeyn CA, Morris L, Williamson C, Robinson JE, Decker JM, Li Y, Salazar MG, Polonis VR, Mlisana K, Karim SA, Hong K, Greene KM, Bilska M, Zhou J, Allen S, Chomba E, Mulenga J, Vwalika C, Gao F, Zhang M, Korber BTM, Hunter E, Hahn BH, Montefiori DC. 2006. Genetic and neutralization properties of subtype C human immunodeficiency virus type 1 molecular env clones from acute and early heterosexually acquired infections in Southern Africa. J Virol 80:11776–11790. doi:10.1128/JVI.01730-06. - DOI - PMC - PubMed
    1. Ping L-H, Joseph SB, Anderson JA, Abrahams M-R, Salazar-Gonzalez JF, Kincer LP, Treurnicht FK, Arney L, Ojeda S, Zhang M, Keys J, Potter EL, Chu H, Moore P, Salazar MG, Iyer S, Jabara C, Kirchherr J, Mapanje C, Ngandu N, Seoighe C, Hoffman I, Gao F, Tang Y, Labranche C, Lee B, Saville A, Vermeulen M, Fiscus S, Morris L, Karim SA, Haynes BF, Shaw GM, Korber BT, Hahn BH, Cohen MS, Montefiori D, Williamson C, Swanstrom R, CAPRISA Acute Infection Study and the Center for HIV-AIDS Vaccine Immunology Consortium. 2013. Comparison of viral Env proteins from acute and chronic infections with subtype C human immunodeficiency virus type 1 identifies differences in glycosylation and CCR5 utilization and suggests a new strategy for immunogen design. J Virol 87:7218–7233. doi:10.1128/JVI.03577-12. - DOI - PMC - PubMed
    1. Sleasman JW, Aleixo LF, Morton A, Skoda-Smith S, Goodenow MM. 1996. CD4+ memory T cells are the predominant population of HIV-1-infected lymphocytes in neonates and children. AIDS 10:1477–1484. doi:10.1097/00002030-199611000-00004. - DOI - PubMed
    1. Douek DC, Brenchley JM, Betts MR, Ambrozak DR, Hill BJ, Okamoto Y, Casazza JP, Kuruppu J, Kunstman K, Wolinsky S, Grossman Z, Dybul M, Oxenius A, Price DA, Connors M, Koup RA. 2002. HIV preferentially infects HIV-specific CD4+ T cells. Nature 417:95–98. doi:10.1038/417095a. - DOI - PubMed

Publication types

MeSH terms