. 2015 Sep 3:6:14.
doi: 10.1186/s13100-015-0045-5. eCollection 2015.

A host factor supports retrotransposition of the TRE5-A population in Dictyostelium cells by suppressing an Argonaute protein

Affiliations

A host factor supports retrotransposition of the TRE5-A population in Dictyostelium cells by suppressing an Argonaute protein

Anika Schmith et al. Mob DNA. .

Abstract

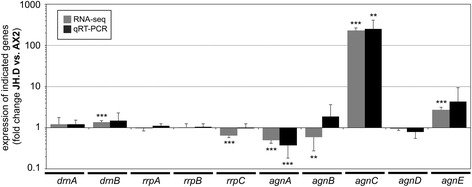
Background: In the compact and haploid genome of Dictyostelium discoideum control of transposon activity is of particular importance to maintain viability. The non-long terminal repeat retrotransposon TRE5-A amplifies continuously in D. discoideum cells even though it produces considerable amounts of minus-strand (antisense) RNA in the presence of an active RNA interference machinery. Removal of the host-encoded C-module-binding factor (CbfA) from D. discoideum cells resulted in a more than 90 % reduction of both plus- and minus-strand RNA of TRE5-A and a strong decrease of the retrotransposition activity of the cellular TRE5-A population. Transcriptome analysis revealed an approximately 230-fold overexpression of the gene coding for the Argonaute-like protein AgnC in a CbfA-depleted mutant.

Results: The D. discoideum genome contains orthologs of RNA-dependent RNA polymerases, Dicer-like proteins, and Argonaute proteins that are supposed to represent RNA interference pathways. We analyzed available mutants in these genes for altered expression of TRE5-A. We found that the retrotransposon was overexpressed in mutants lacking the Argonaute proteins AgnC and AgnE. Because the agnC gene is barely expressed in wild-type cells, probably due to repression by CbfA, we employed a new method of promoter-swapping to overexpress agnC in a CbfA-independent manner. In these strains we established an in vivo retrotransposition assay that determines the retrotransposition frequency of the cellular TRE5-A population. We observed that both the TRE5-A steady-state RNA level and retrotransposition rate dropped to less than 10 % of wild-type in the agnC overexpressor strains.

Conclusions: The data suggest that TRE5-A amplification is controlled by a distinct pathway of the Dictyostelium RNA interference machinery that does not require RNA-dependent RNA polymerases but involves AgnC. This control is at least partially overcome by the activity of CbfA, a factor derived from the retrotransposon's host. This unusual regulation of mobile element activity most likely had a profound effect on genome evolution in D. discoideum.

Keywords: Argonaute; Dictyostelium; RNAi; Retrotransposition; siRNA.


Figures

Fig. 1
Fig. 1
Expression of mobile elements in the CbfA underexpressing mutant JH.D. Expression data are derived from a previous RNA-seq analysis [28]. RPKM values (reads per kb of mRNA and standardized to 1 million reads) were obtained for the indicated mobile elements and calculated as ratio of JH.D versus AX2 and are shown as “fold change” of expression, meaning that values >1 represent overexpression of genes in JH.D. Values are means from three independent cultures ± SD. *p < 0.05, **p < 0.01, ***p < 0.001, relative to control AX2 cells (Student’s t-test). Black bars indicate non-LTR retrotransposons, grey bars indicate LTR retrotransposons (including the tyrosine recombinase retrotransposon DIRS-1), and white bars indicate putative DNA transposons
Fig. 2
Fig. 2
Expression of RNAi components in CbfA mutant JH.D cells. Expression of Dicer-like proteins (drnA, drnB), RdRPs (rrpA-C) and Argonaute genes (agnA-E) was analyzed by RNA-seq (gray bars, n = 3) in wild-type AX2 and CbfA-mutant JH.D cells from three independent cultures [28]. These three RNA samples, and RNA from three additional independent cultures, were analyzed by qRT-PCR (black bars, n = 6). Data are shown as fold change of expression with values >1 meaning that expression in the mutant cells was higher than in the control cells. Values are means ± SD from three and six independent cultures, respectively. **p < 0.01, ***p < 0.001, relative to wild-type AX2 cells (Student’s t-test)
Fig. 3
Fig. 3
CbfA controls AgnC expression. a Scheme of the CbfA protein. The 1000-amino acid protein can be roughly divided into an amino-terminal part that may have chromatin-remodeling activity and a carboxy-terminal part that may facilitate DNA-binding [28, 39]. JmjC: carboxy-terminal jumonji domain", ZF: zinc finger-like motif; NRD: asparagine-rich domain; CTD: carboxy-terminal domain. The CbfA proteins expressed in mutant JH.D comprised either the full length protein (amino acids 2–1000) or the CbfA-CTD (amino acids 724–1000). b Expression of CbfA in JH.D cells. CbfA mutant JH.D cells were transformed with plasmids allowing for the expression of either untagged, full-length CbfA [21] or the GFP-tagged, carboxy-terminal domain of CbfA (CbfA-CTD) [28]. Shown is a western blot of whole-cell extracts prepared from the indicated strains. CbfA was visualized with the monoclonal antibody 7 F3 that detects CbfA-CTD. Numbers to the left indicate the sizes of the protein standards in kDa. c Complementation of the agnC overexpression phenotype in JH.D cells. Expression of agnC in the indicated strains was determined by qRT-PCR. Expression levels in JH.D cells and JH.D transformants were compared to AX2 wild-type cells and are expressed as “fold change” of expression, meaning that values >1 represent overexpression of genes in the JH.D strains and a value of 1 would indicate complete reversion of the overexpression in JH.D cells. Values are means from six independent cultures ± SD. **p < 0.01, relative to control AX2 cells (Student’s t-test)
Fig. 4
Fig. 4
Expression of TRE5-A in knockout mutants of RNAi components. Expression of TRE5-A ORF1 was analyzed by qRT-PCR in the indicated knockout mutants of Argonaute genes and the Dicer-like protein DrnB. Phenotype reversion in agnC and agnE knockouts was accomplished using TAP-tagged agnC and agnE overexpressed in the respective mutants (agnC [agnC OE] and agnE [ agnE OE]). TRE5-A expression in JH.D cells is shown for comparison. Expression levels were compared to AX2 wild-type cells and are expressed as fold change of expression, meaning that values >1 represent overexpression of genes in the mutants. Data represent means from three independent cultures ± SD. *p < 0.05, **p < 0.01 relative to AX2 cells (Student’s t-test)
Fig. 5
Fig. 5
TRE5-A expression in agnC GA mutants. a Construction of agnC “gene activation” mutants. The agnC locus on chromosome 2 is indicated by nucleotide positions. The gene activation cassette consisted of a hybrid actin6/actin15 promoter (arrows indicate transcription direction). The BamHI arm contained a 1200 bp DNA fragment covering the complete coding sequence of gene DDB_G0271884, including 273 bp of upstream sequence. The HindIII arm contained 1200 bp of agnC coding sequence, including the original translation start site. After double-recombination of the agnC GA vector with genomic DNA, the expression of agnC was driven by the act15 promoter, whereas expression of the neighboring gene DDB_G0271884 was unaffected. b Semi-quantitative RT-PCR analysis of RNA from AX2, JH.D, and three independent agnC GA mutants demonstrating overexpression of agnC, normal expression of the neighboring gene DDB_G0271884 and gpdA (loading control), and silencing of TRE5-A (ORF1 and ORF2 sequences). NTC: no template control. c Quantitative RT-PCR of TRE5-A (ORF1) expression on RNA from JH.D and three agnC GA mutants. Expression levels were compared to AX2 cells and are expressed as fold change of expression, meaning that values <1 represent lower levels of TRE5-A in the mutants relative to wild-type AX2 cells. Data represent means from four independent cultures of the indicated strains ± SD
Fig. 6
Fig. 6
Outline of the TRE trap retrotransposition assay. The TRE trap gene is a modified version of the pyr56 gene, which codes for the D. discoideum UMP synthase. The pyr56 gene contains an intron (dashed line; SD: splice donor site, SA: splice acceptor site) into shich a tRNA gene is inserted as bait for the integration of TRE5-A. The TRE trap gene is transformed into the ura strain DH1 that has a complete deletion of the pyr56 gene. The TRE trap gene converts transformants to ura+ because the intron is functionally spliced. If an element of the endogenous TRE5-A population targets the tRNA gene in the TRE trap gene for integration, the TRE trap gene is disrupted even if the integration actually occurs in the intronic sequence. The resulting ura cells gain resistance to the drug 5-fluoroorotic acid (5-FOA) and grow out clonally if uracil is added to the medium [18]
Fig. 7
Fig. 7
Retrotransposition of the TRE5-A population in agnC overexpressing strains. a Semi-quantitative RT-PCR analysis of RNA from DH1 and three independent DH1[agnC GA] mutants. Note that agnC was overexpressed comapred to DH1. Expression of the neighboring gene DDB_G0271884 (compare Figure 5) was not affected, whereas expression of TRE5-A ORF1 was reduced in the agnC GA mutants. Expression of the house-keeping gene gpdA is shown as control. NTC: no template control. b DH1 and DH1[agnC GA] cells were transformed with either the empty TRE trap gene (i.e., no tRNA gene inserted in the intron) or the TRE trap gene containing a Val UAC tRNA gene. In this TRE trap assay, one clone of DH1 transformants and two independent clones of DH1[agnC GA] cells (clones #1 and #2) were analyzed for TRE5-A retrotransposition. For each strain, five plates containing 107 cells each were prepared. Cells were cultured in FM medium containing 5-FOA and uracil until clones appeared. Clones were counted and results are presented as retrotransposition frequency ± SD. ***p < 0.001 (Student’s t-test). This assay was reproduced once with similar results

References

    1. Cordaux R, Batzer MA. The impact of retrotransposons on human genome evolution. Nature Rev Genet. 2009;10:691–703. doi: 10.1038/nrg2640. - DOI - PMC - PubMed
    1. Kazazian HH. Mobile elements: drivers of genome evolution. Science. 2004;303:1626–32. doi: 10.1126/science.1089670. - DOI - PubMed
    1. Levin HL, Moran JV. Dynamic interactions between transposable elements and their hosts. Nat Rev Genet. 2011;12:615–27. doi: 10.1038/nrg3030. - DOI - PMC - PubMed
    1. Scheifele LZ, Cost GJ, Zupancic ML, Caputo EM, Boeke JD. Retrotransposon overdose and genome integrity. Proc Natl Acad Sci USA. 2009;106:13927–32. doi: 10.1073/pnas.0906552106. - DOI - PMC - PubMed
    1. Siomi H, Siomi MC. On the road to reading the RNA-interference code. Nature. 2009;457:396–404. doi: 10.1038/nature07754. - DOI - PubMed

LinkOut - more resources