. 2015:2015:671349.
doi: 10.1155/2015/671349. Epub 2015 Aug 3.

On the Estimation of Heritability with Family-Based and Population-Based Samples

Affiliations

On the Estimation of Heritability with Family-Based and Population-Based Samples

Youngdoe Kim et al. Biomed Res Int. 2015.

Abstract

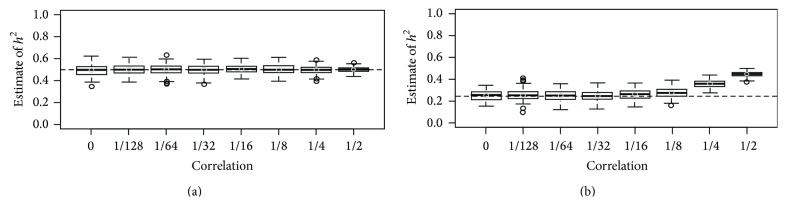
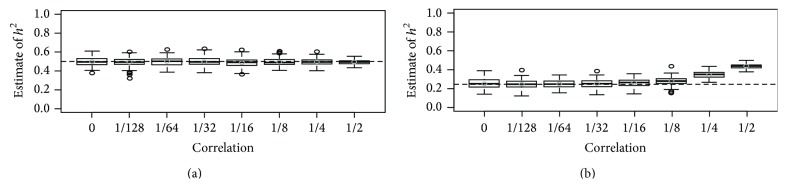
For a family-based sample, the phenotypic variance-covariance matrix can be parameterized to include the variance of a polygenic effect that has then been estimated using a variance component analysis. However, with the advent of large-scale genomic data, the genetic relationship matrix (GRM) can be estimated and can be utilized to parameterize the variance of a polygenic effect for population-based samples. Therefore narrow sense heritability, which is both population and trait specific, can be estimated with both population- and family-based samples. In this study we estimate heritability from both family-based and population-based samples, collected in Korea, and the heritability estimates from the pooled samples were, for height, 0.60; body mass index (BMI), 0.32; log-transformed triglycerides (log TG), 0.24; total cholesterol (TCHL), 0.30; high-density lipoprotein (HDL), 0.38; low-density lipoprotein (LDL), 0.29; systolic blood pressure (SBP), 0.23; and diastolic blood pressure (DBP), 0.24. Furthermore, we found differences in how heritability is estimated--in particular the amount of variance attributable to common environment in twins can be substantial--which indicates heritability estimates should be interpreted with caution.


Figures

Figure 1
Figure 1
Heritability estimates for various levels of genetic correlation with 10,000 individuals when h 2 was set at 0.5 and all causal variants were generated from U(0,0.1). We generated 5,000 pairs of individuals with 100,000 SNPs, and each box-plot was generated with results from 200 replicates. The dashed horizontal line indicates the proportion of the total phenotypic variance explained by the SNPs used for calculating the GRM, and the estimates of heritability with GCTA are plotted against the correlation between family members. In (a), 100 causal SNPs were used to estimate the GRM, and in (b), 50 randomly selected causal SNPs were used. The horizontal dotted line indicates the relative proportion of variance explained by the SNPs.
Figure 2
Figure 2
Heritability estimates for various levels of genetic correlation with 10,000 individuals when h 2 was set at 0.5 and all causal variants were generated from U(0.1, 0.4). We generated 5,000 pairs of individuals with 100,000 SNPs, and each box-plot was generated with results from 200 replicates. The dashed horizontal line indicates the proportion of the total phenotypic variance explained by the SNPs used for calculating the GRM, and the estimates of heritability with GCTA are plotted against the correlation between family members. In (a), 100 causal SNPs were used to estimate the GRM, and in (b), 50 randomly selected causal SNPs were used. The horizontal dotted line indicates the relative proportion of variance explained by the SNPs.

References

    1. Zuk O., Hechter E., Sunyaev S. R., Lander E. S. The mystery of missing heritability: genetic interactions create phantom heritability. Proceedings of the National Academy of Sciences of the United States of America. 2012;109(4):1193–1198. doi: 10.1073/pnas.1119675109. - DOI - PMC - PubMed
    1. Almasy L., Blangero J. Multipoint quantitative-trait linkage analysis in general pedigrees. The American Journal of Human Genetics. 1998;62(5):1198–1211. doi: 10.1086/301844. - DOI - PMC - PubMed
    1. Falconer D. S. Introduction to Quantitative Genetics. New York, NY, USA: Ronald Press; 1960.
    1. Fisher R. A. The correlation between relatives on the supposition of mendelian inheritance. Transactions of the Royal Society of Edinburgh. 1918;52:399–433.
    1. Visscher P. M., Hill W. G., Wray N. R. Heritability in the genomics era—concepts and misconceptions. Nature Reviews Genetics. 2008;9(4):255–266. doi: 10.1038/nrg2322. - DOI - PubMed

Publication types

MeSH terms

LinkOut - more resources