. 2015 Sep 4;10(9):e0137411.
doi: 10.1371/journal.pone.0137411. eCollection 2015.

Negative Regulation of p21Waf1/Cip1 by Human INO80 Chromatin Remodeling Complex Is Implicated in Cell Cycle Phase G2/M Arrest and Abnormal Chromosome Stability

Affiliations

Negative Regulation of p21Waf1/Cip1 by Human INO80 Chromatin Remodeling Complex Is Implicated in Cell Cycle Phase G2/M Arrest and Abnormal Chromosome Stability

Lingling Cao et al. PLoS One. .

Abstract

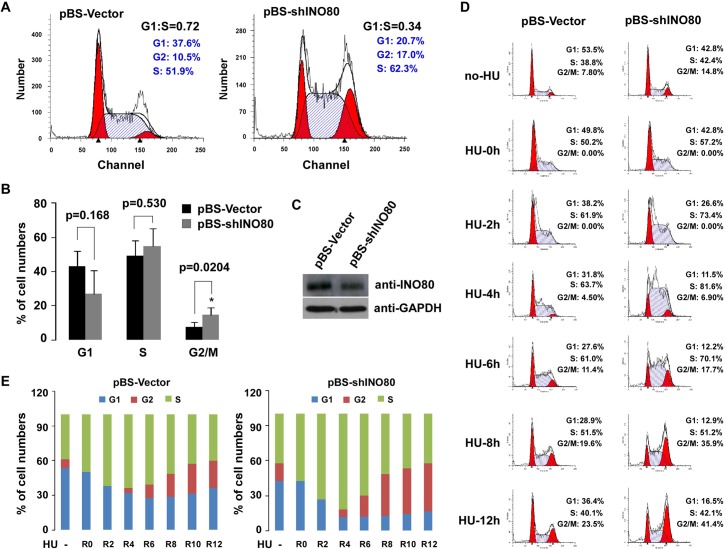
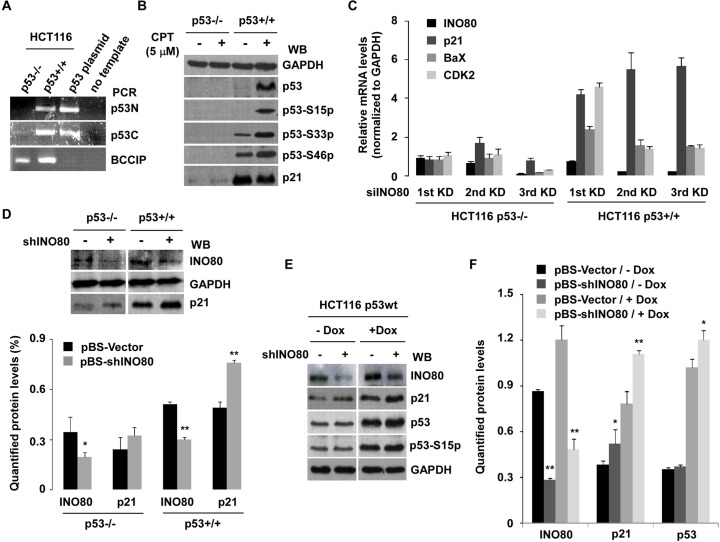
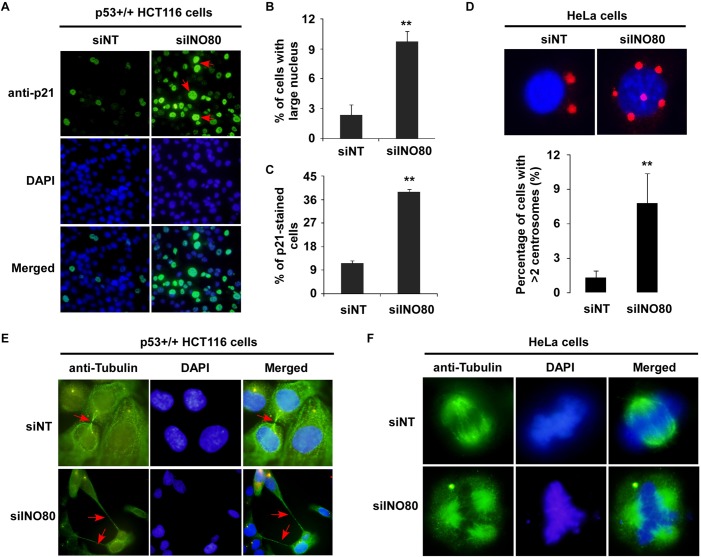
We previously identified an ATP-dependent human Ino80 (INO80) chromatin remodeling complex which shares a set of core subunits with yeast Ino80 complex. Although research evidence has suggested that INO80 complex functions in gene transcription and genome stability, the precise mechanism remains unclear. Herein, based on gene expression profiles from the INO80 complex-knockdown in HeLa cells, we first demonstrate that INO80 complex negatively regulates the p21Waf1/Cip1 (p21) expression in a p53-mediated mechanism. In chromatin immunoprecipitation (ChIP) and a sequential ChIP (Re-ChIP) assays, we determined that the INO80 complex and p53 can bind to the same promoter region of p21 gene (-2.2 kb and -1.0 kb upstream of the p21 promoter region), and p53 is required for the recruitment of the INO80 complex to the p21 promoter. RNAi knockdown strategies of INO80 not only led to prolonged progression of cell cycle phase G2/M to G1, but it also resulted in abnormal chromosome stability. Interestingly, high expression of p21 was observed in most morphologically-changed cells, suggesting that negative regulation of p21 by INO80 complex might be implicated in maintaining the cell cycle process and chromosome stability. Together, our findings will provide a theoretical basis to further elucidate the cellular mechanisms of the INO80 complex.


Conflict of interest statement

Competing Interests: The authors have declared that no competing interests exist.

Figures

Fig 1
Fig 1. Analysis of gene expression profiles in INO80-, hIes2-, hIes6-, and hArp8- siRNA knockdown HeLa cells.
To verify the siRNA knockdown efficiency, cells were transfected with 20pmol indicated siRNAs and non-targeting siRNA (siNT, as control). 48 hours after transfection, cells were harvested and lysed for immunoblotting, RT-qPCR, and DNA microarray analysis (DNA microarray was performed once). Total RNA was isolated with Trizol (Invitrogen), and the specific gene expression (all signals normalized to siNT) was measured by RT-qPCR (A). Whole-cell extract (WCE) was prepared by adding 4 × SDS loading buffer. Specific proteins were detected by western blot (WB) with indicated antibodies (B). Overlapping of differentially expressed genes (DEGs) in INO80-, hIes2-, hIes6- and hArp8-siRNA knockdown HeLa cells. DEGs between the knockdown samples and siNT control were assessed by the Illumina Custom differential expression algorithm that was conducted by software package Genomestudio V2011. Then, entrez gene IDs were exploited for Venn diagram plotting including 2159 genes for Ies2, 1936 genes for INO80, 2707 genes for Ies6, and 1445 genes for Arp8 (C).
Fig 2
Fig 2. Prolonged progression of G2/M to G1 occurred in INO80-knockdown 293T cells.
(A) Flow cytometry analysis of INO80-knockdown 293T cell cycle. 293T cells were transfected with pBS-shINO80 plasmids and pBS-Vector (as control). 48 hours after transfection, cells were harvested by trypsinization. Fluorescence-activated cell sorting (FACS) analysis of propidium iodide-stained cells was performed. (B) Analysis of the subpopulation of cells in cell cycle phases G1, S and G2/M. *p < 0.05 in comparison with pBS-Vector control (Student t test). (C) Verification of pBS-shINO80 knockdown efficiency. Prepared WCE from pBS-shINO80 (2 μg/well/6-well plate) treated 293T cells was subjected to SDS-PAGE (6% or 12% gel), and specific proteins were detected by WB with indicated antibodies. (D) Delayed progression of G2/M to G1 phase in pBS-shINO80 treated cells. pBS-shINO80 or pBS-Vector transfected 293T cells were synchronized by treatment with 1mM HU for 24 hours incubation. Cells were harvested by trypsinization 0, 2, 4, 6, 8, and 12 hrs after removal of HU. Acquired data was analyzed using ModFit LT software (Verity Software House). (E) Quantified cell cycle distribution in pBS-shINO80 or pBS-Vector transfected 293T cells.
Fig 3
Fig 3. Up-regulation of CDKN1A (p21Waf1/Cip1) was observed in INO80 complex knockdown HeLa or 293T cells.
(A) Verification of the mRNA of select genes from gene expression profiles. HeLa cells were transfected with 15pmol INO80- or hArp8-siRNA and siNT (as control). 48 hours after transfection, cells were harvested, and select genes from gene expression profiles were assessed by RT-qPCR. Bar graphs show ratios of RT-qPCR signals to GAPDH (all signals normalized to siNT). Error bars represent the standard error of the mean of 3 independent experiments. (B) Elevation of p21 protein expression in INO80- or hArp8-siRNA knockdown 293T cells. Cells were treated with indicated siRNA. 48 hours later, proteins were detected with WB using indicated antibodies. (C) High expression of p21 protein in cells as assessed by immunofluorescence. INO80- or hArp8-siRNA (15 or 30pmol) and siNT control was transfected into HeLa cells. 48 hours after transfection, immunofluorescence staining was performed. DAPI staining shows total nuclei. p21-positive cells were counted, and the percentage in the total cell numbers was represented in bar graph (D). Error bars represent the standard error of the mean of 2 independent experiments. **p < 0.01 in comparison with siNT control (Student t test).
Fig 4
Fig 4. INO80 complex binds two p53 binding sites on the p21 promoter region in 293T cells.
(A) Six primer sets in the p21 locus used for amplifying ChIP’d DNA. (B) qPCR products from each primer set were subjected to 2.5% agarose gel and visualized by ethidium bromide. (C) Co-occupying of the INO80 complex and p53 at the -2.2kb and -1.0kb upstream of the p21 transcriptional start site. ChIP assays were performed using INO80, YY1, and p53 antibodies in 293T cells. ChIP’d DNA was analyzed by qPCR. Bar graphs show the ratios of ChIP’d DNA signals to IgG (all signals normalized to input). Error bars represent the standard error of the mean of 3 independent experiments. (D) Validation of the recruitment of the INO80 complex at the p21 promoter region. pBS-Vector and pBS-shINO80 transfected 293T cells (48 hours) were used in ChIP assays. ChIP’d DNA with INO80 and YY1 antibodies was analyzed by qPCR. Relative-fold enrichment vs IgG at the -2.2kb and -1.0kb upstream of the p21 transcriptional start site was displayed as bar graphs (all signals normalized to input). Error bars represent the standard error of the mean of 3 independent experiments.
Fig 5
Fig 5. Up-regulation of p21 by INO80-knockdown is evident in p53+/+, but not in p53-/- HCT116 cells.
(A) Clarification of p53 expression in p53+/+ or p53-/- HCT116 cell lines by PCR. Reversed cDNA as template, the p53 gene was amplified by PCR with p53 N-terminal or p53 C-terminal specific primer sets (See Table 1). BCCIP is the PCR control, and p53 plasmid is the positive control of the PCR product. No template in the reaction is the negative control. (B) Western blot analysis. Both cell lines were cultured in IMDM medium containing 5μM CPT for 8 hours. WCE was then prepared, and the proteins were detected with indicated antibodies. (C) High expression of p21 gene in three consecutive INO80-knockdown cells. Both HCT116 cells were transfected with 20pmol INO80 and NT (as control) siRNAs three times every 48 hours. Then, 48 hours after each transfection, cells were harvested for RT-qPCR to assess indicated gene expression. Bar graphs show ratios of RT-qPCR signals to GAPDH (all signals normalized to siNT). (n = 3) (D) Obvious up-regulation of p21 in INO80-knockdown p53+/+ HCT116 cells. HCT116 cells were transfected with 2μg pBS-shINO80 (well/6-well plate) and pBS-Vector (as control). 48 hours later, indicated proteins were detected by WB with specific antibodies. Representative results from three independent experiments are shown in the upper panel. Western blot images (n = 3) were quantified with densitometry using Quantity One Basic software (Bio-Rad). *p < 0.05, **p < 0.01 in comparison with pBS-Vector control (Student t test). (lower panel). (E) p53-dependent up-regulation of p21 in INO80-knockdown cells. p53+/+ HCT116 cells were transfected with pBS-shINO80 or pBS-Vector. 24 hrs after transfection, cells were treated with 0.5μM doxorubicin (Dox) for 24 hours. WCE was then prepared and indicated proteins were measured by WB with specific antibodies. Representative results from three independent experiments are shown. (F) Quantified proteins. Western blot images (n = 3) were quantified with densitometry using Quantity One Basic software. **p < 0.05, p < 0.01 in comparison with pBS-Vector control (Student t test).
Fig 6
Fig 6. Negative regulation of p21 by INO80 complex is in a p53-dependent manner.
(A) Significant up-regulation of p21 by shINO80 in p53FL over-expressed p53-/- HCT116 cells. p53-/- HCT116 cells were co-transfected with 0.5 μg p53FL pcDNA (pcDNA3.1 as control) and 1.0 or 2.0 μg pBS-shINO80 plasmids. 48 hours transfection, proteins were analyzed by WB with indicated antibodies. (B) Binding of INO80 to p21 gene in p53+/+ HCT116 cells. ChIP assays were performed using INO80 antibody in p53+/+ or p53-/- HCT116 cells. ChIP’d DNA was analyzed by qPCR. Bar graph shows the ratios of ChIP’d DNA signals to IgG (all signals normalized to input). Error bars represent the standard error of the mean of 2 independent experiments. (C) Re-ChIP Experimental procedure. (D) Binding of INO80 and p53 to the same promoter region of p21 gene in 293T cells. A sequential ChIP according to the experimental procedure shown in C was carried out using INO80 and p53 antibodies in 293T cells. ChIP’d DNA was analyzed by qPCR (all ChIPs were normalized to input). Bar graphs show the relative fold enrichment of the INO80 and p53 vs IgG. Error bars represent the standard error of the mean of 2 independent experiments.
Fig 7
Fig 7. Abnormal chromosome stability resulted from INO80-knockdown in p53+/+ HCT116 or HeLa cells.
(A) Morphological changes in siINO80 knockdown p53+/+ HCT116 cells. Representative large nuclei cells were stained with anti-p21 (green). Arrows indicate p21-stained cells with large nuclei. DAPI staining shows total nuclei. (B) Percentage of cells with morphology change. Obvious large nuclei cells in siNT and siINO80 cells were counted, and the percentage in the total cell numbers are represented in the bar graph. Error bars represent the standard error of the mean of three independent experiments. More than 400 cells were scored from each experiment. **p < 0.01 in comparison with siNT-control. (C) Number of p21-stained cells. More than 400 cells were counted from each group. **p < 0.01 in comparison with siNT-control. (D) Percentage of cells with more than two centrosomes per nucleus. Centrosomes in INO80 knockdown HeLa cells were stained with anti-pericentrin (red), and nuclei with DAPI (blue) (upper panel). Percentage of cells with more than two centrosomes per nucleus is shown in the lower panel. Error bars represent the standard error of the mean of two independent experiments. More than 200 cells were scored from each experiment. **p < 0.01 in comparison with siNT-control. (E) Cytokinesis failure in INO80-knockdown p53+/+ HCT116 cells. Cells were stained with anti-tubulin (green). (F) Multipolar spindle formations in INO80 knockdown HeLa cells. Mitotic spindle was stained with anti-α-tubulin.

Similar articles

Cited by

References

    1. Watanabe S, Peterson CL. The INO80 family of chromatin-remodeling enzymes: regulators of histone variant dynamics. Cold Spring Harb Symp Quant Biol. 2010; 75: 35–42. 10.1101/sqb.2010.75.063 - DOI - PubMed
    1. Jin J, Cai Y, Yao T, Gottschalk AJ, Florens F, Swanson SK, et al. A mammalian chromatin remodeling complex with similarities to the yeast INO80 complex. J Biol Chem.2005; 280: 41207–12. - PubMed
    1. Cai Y, Jin J, Yao T, Gottschalk AJ, Swanson SK, Wu S, et al. YY1 functions with INO80 to activate transcription. Nat Struc Mol Biol. 2007; 14: 872–4. - PubMed
    1. Hur SK, Park EJ, Han JE, Kim YA, Kim JD, Kang D, et al. Roles of human INO80 chromatin remodeling enzyme in DNA replication and chromosome segregation suppress genome instability. Cell Mol Life Sci. 2010; 67: 2283–96. 10.1007/s00018-010-0337-3 - DOI - PMC - PubMed
    1. Vassileva I, Yanakieva I, Peycheva M, Gospodinov A, Anachkova B. The mammalian INO80 chromatin remodeling complex is required for replication stress recovery. Nucleic Acids Res. 2014; 14: 9074–86. - PMC - PubMed

Publication types

MeSH terms