

Professional Fee Ratios for US Hospital Discharge Data
- PMID: 26340662
- PMCID: PMC4681390
- DOI: 10.1097/MLR.0000000000000410
Professional Fee Ratios for US Hospital Discharge Data
Erratum in
- Med Care. 2016 Feb;54(2):218
Abstract
Background: US hospital discharge datasets typically report facility charges (ie, room and board), excluding professional fees (ie, attending physicians' charges).
Objectives: We aimed to estimate professional fee ratios (PFR) by year and clinical diagnosis for use in cost analyses based on hospital discharge data.
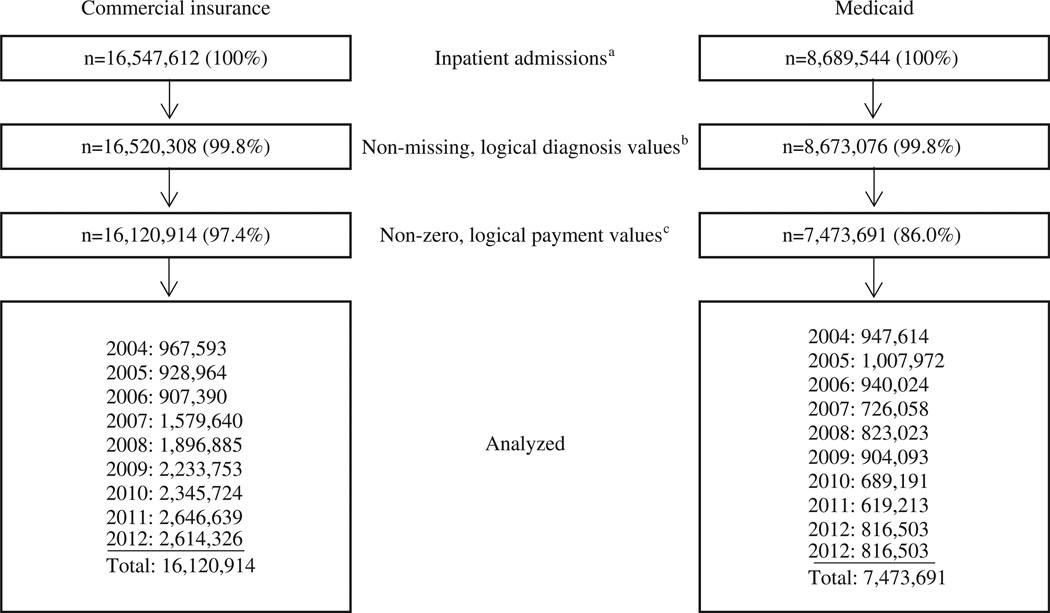
Subjects: The subjects consisted of a retrospective cohort of Truven Health MarketScan 2004-2012 inpatient admissions (n=23,594,605) and treat-and-release emergency department (ED) visits (n=70,771,576).
Measures: PFR per visit was assessed as total payments divided by facility-only payments.
Research design: Using ordinary least squares regression models controlling for selected characteristics (ie, patient age, comorbidities, etc.), we calculated adjusted mean PFR for admissions by health insurance type (commercial or Medicaid) per year overall and by Major Diagnostic Category (MDC), Diagnostic Related Group, Healthcare Cost and Utilization Project Clinical Classification Software, and primary International Classification of Diseases, 9th Edition, Clinical Modification (ICD-9-CM) diagnosis, and for ED visits per year overall and by MDC and primary ICD-9-CM diagnosis.
Results: Adjusted mean PFR for 2012 admissions, including preceding ED visits, was 1.264 (95% CI, 1.264, 1.265) for commercially insured admissions (n=2,614,326) and 1.177 (1.176, 1.177) for Medicaid admissions (n=816,503), indicating professional payments increased total per-admission payments by an average 26.4% and 17.7%, respectively, above facility-only payments. Adjusted mean PFR for 2012 ED visits was 1.286 (1.286, 1.286) for commercially insured visits (n=8,808,734) and 1.440 (1.439, 1.440) for Medicaid visits (n=2,994,696). Supplemental tables report 2004-2012 annual PFR estimates by clinical classifications.
Conclusions: Adjustments for professional fees are recommended when hospital facility-only financial data from US hospital discharge datasets are used to estimate health care costs.
Conflict of interest statement
The authors declare no conflict of interest.
Figures

Comment in
-
Doctors and Their Workshops.Med Care. 2015 Oct;53(10):837-9. doi: 10.1097/MLR.0000000000000434. Med Care. 2015. PMID: 26366516 No abstract available.
References
-
- Love D, Rudolph B, Shah GH. Lessons learned in using hospital discharge data for state and national public health surveillance: implications for Centers for Disease Control and prevention tracking program. J Public Health Manag Pract. 2008;14:533–542. - PubMed
-
- Agency for Healthcare Research and Quality. Overview of HCUP. [Accessed January 22, 2014];2011 Available at: http://www.ahrq.gov/research/data/hcup/index.html.
-
- Healthcare Cost and Utilization Project. HCUP comorbidity software (version 3.7) [Accessed March 4, 2014];2013 Available at: http://www.hcup-us.ahrq.gov/reports/pubsearch/pubsearch.jsp.
-
- Schoenman J, Sutton J, Kintala S, et al. The Value of Hospital Discharge Databases. Rockville, MD: Agency for Healthcare Research and Quality; 2005.
-
- Schoenman JA, Sutton JP, Elixhauser A, et al. Understanding and enhancing the value of hospital discharge data. Med Care Res Rev. 2007;64:449–468. - PubMed
MeSH terms
Grants and funding
LinkOut - more resources
Full Text Sources
Medical
