

Effect of Repeated Glucagon Doses on Hepatic Glycogen in Type 1 Diabetes: Implications for a Bihormonal Closed-Loop System
- PMID: 26341131
- PMCID: PMC4613914
- DOI: 10.2337/dc15-0754
Effect of Repeated Glucagon Doses on Hepatic Glycogen in Type 1 Diabetes: Implications for a Bihormonal Closed-Loop System
Abstract
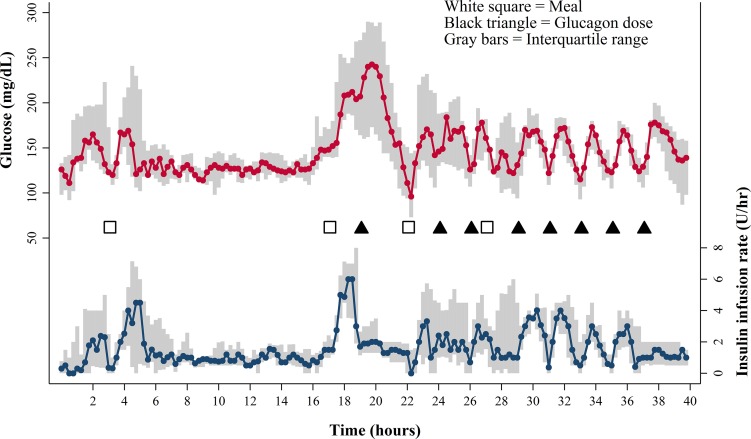
Objective: To evaluate subjects with type 1 diabetes for hepatic glycogen depletion after repeated doses of glucagon, simulating delivery in a bihormonal closed-loop system.
Research design and methods: Eleven adult subjects with type 1 diabetes participated. Subjects underwent estimation of hepatic glycogen using (13)C MRS. MRS was performed at the following four time points: fasting and after a meal at baseline, and fasting and after a meal after eight doses of subcutaneously administered glucagon at a dose of 2 µg/kg, for a total mean dose of 1,126 µg over 16 h. The primary and secondary end points were, respectively, estimated hepatic glycogen by MRS and incremental area under the glucose curve for a 90-min interval after glucagon administration.
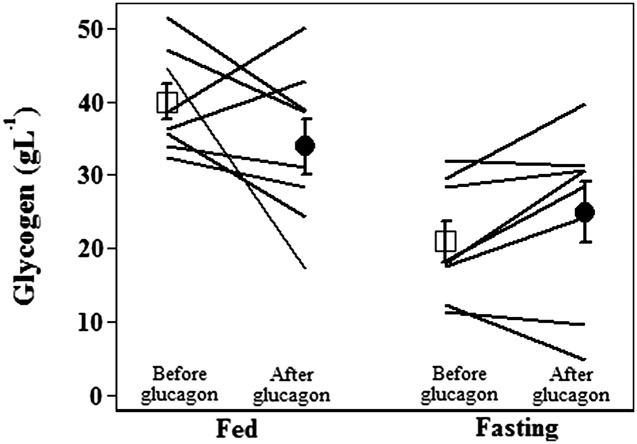
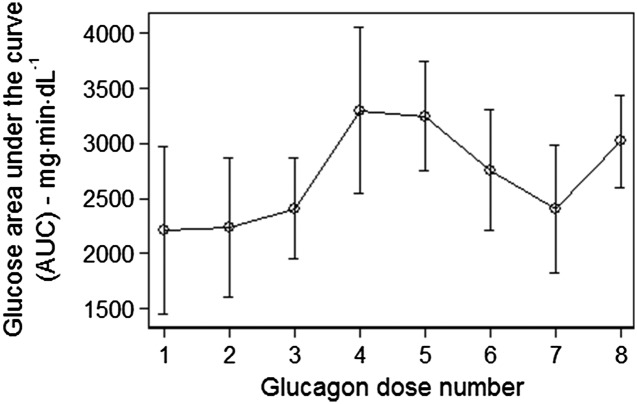
Results: In the eight subjects with complete data sets, estimated glycogen stores were similar at baseline and after repeated glucagon doses. In the fasting state, glycogen averaged 21 ± 3 g/L before glucagon administration and 25 ± 4 g/L after glucagon administration (mean ± SEM) (P = NS). In the fed state, glycogen averaged 40 ± 2 g/L before glucagon administration and 34 ± 4 g/L after glucagon administration (P = NS). With the use of an insulin action model, the rise in glucose after the last dose of glucagon was comparable to the rise after the first dose, as measured by the 90-min incremental area under the glucose curve.
Conclusions: In adult subjects with well-controlled type 1 diabetes (mean A1C 7.2%), glycogen stores and the hyperglycemic response to glucagon administration are maintained even after receiving multiple doses of glucagon. This finding supports the safety of repeated glucagon delivery in the setting of a bihormonal closed-loop system.
Trial registration: ClinicalTrials.gov NCT01986231.
© 2015 by the American Diabetes Association. Readers may use this article as long as the work is properly cited, the use is educational and not for profit, and the work is not altered.
Figures
Similar articles
-
Effects of subcutaneous, low-dose glucagon on insulin-induced mild hypoglycaemia in patients with insulin pump treated type 1 diabetes.Diabetes Obes Metab. 2016 Apr;18(4):410-8. doi: 10.1111/dom.12627. Epub 2016 Feb 9. Diabetes Obes Metab. 2016. PMID: 26743775 Clinical Trial.
-
Effects of Preceding Ethanol Intake on Glucose Response to Low-Dose Glucagon in Individuals With Type 1 Diabetes: A Randomized, Placebo-Controlled, Crossover Study.Diabetes Care. 2018 Apr;41(4):797-806. doi: 10.2337/dc17-1458. Epub 2018 Jan 22. Diabetes Care. 2018. PMID: 29358493 Clinical Trial.
-
Novel use of glucagon in a closed-loop system for prevention of hypoglycemia in type 1 diabetes.Diabetes Care. 2010 Jun;33(6):1282-7. doi: 10.2337/dc09-2254. Epub 2010 Mar 23. Diabetes Care. 2010. PMID: 20332355 Free PMC article. Clinical Trial.
-
Dual-hormone treatment with insulin and glucagon in patients with type 1 diabetes.Diabetes Metab Res Rev. 2015 Oct;31(7):672-9. doi: 10.1002/dmrr.2632. Epub 2015 Feb 12. Diabetes Metab Res Rev. 2015. PMID: 25533565 Review.
-
Glucagon treatment in type 1 diabetes -with focus on restoring plasma glucose during mild hypoglycemia .Dan Med J. 2018 Feb;65(2):B5449. Dan Med J. 2018. PMID: 29393039 Review.
Cited by
-
Dual-hormone artificial pancreas for management of type 1 diabetes: Recent progress and future directions.Artif Organs. 2021 Sep;45(9):968-986. doi: 10.1111/aor.14023. Epub 2021 Jul 15. Artif Organs. 2021. PMID: 34263961 Free PMC article. Review.
-
Magnetic Resonance Imaging and Spectroscopy Methods to Study Hepatic Glucose Metabolism and Their Applications in the Healthy and Diabetic Liver.Metabolites. 2022 Dec 5;12(12):1223. doi: 10.3390/metabo12121223. Metabolites. 2022. PMID: 36557261 Free PMC article. Review.
-
Current Advances of Artificial Pancreas Systems: A Comprehensive Review of the Clinical Evidence.Diabetes Metab J. 2021 Nov;45(6):813-839. doi: 10.4093/dmj.2021.0177. Epub 2021 Nov 22. Diabetes Metab J. 2021. PMID: 34847641 Free PMC article. Review.
-
Multivariable Adaptive Artificial Pancreas System in Type 1 Diabetes.Curr Diab Rep. 2017 Aug 15;17(10):88. doi: 10.1007/s11892-017-0920-1. Curr Diab Rep. 2017. PMID: 28812204 Review.
-
A Glucose-Responsive Glucagon-Micelle for the Prevention of Hypoglycemia.ACS Cent Sci. 2024 Oct 2;10(11):2036-2047. doi: 10.1021/acscentsci.4c00937. eCollection 2024 Nov 27. ACS Cent Sci. 2024. PMID: 39634211 Free PMC article.
References
-
- Centers for Disease Control and Prevention National Diabetes Statistics Report: Estimates of Diabetes and Its Burden in the United States, 2014. Atlanta, GA, U.S. Department of Health and Human Services, 2014
-
- The Diabetes Control and Complications Trial Research Group . The effect of intensive treatment of diabetes on the development and progression of long-term complications in insulin-dependent diabetes mellitus. N Engl J Med 1993;329:977–986 - PubMed
-
- Peyser T, Dassau E, Breton M, Skyler JS. The artificial pancreas: current status and future prospects in the management of diabetes. Ann N Y Acad Sci 2014;1311:102–123 - PubMed
-
- Lindholm A, Jacobsen LV. Clinical pharmacokinetics and pharmacodynamics of insulin aspart. Clin Pharmacokinet 2001;40:641–659 - PubMed
-
- Graf CJ, Woodworth JR, Seger ME, Holcombe JH, Bowsher RR, Lynch R. Pharmacokinetic and glucodynamic comparisons of recombinant and animal-source glucagon after IV, IM, and SC injection in healthy volunteers. J Pharm Sci 1999;88:991–995 - PubMed
Publication types
MeSH terms
Substances
Associated data
Grants and funding
LinkOut - more resources
Full Text Sources
Other Literature Sources
Medical
Miscellaneous
