

Bayesian Inference Reveals Host-Specific Contributions to the Epidemic Expansion of Influenza A H5N1
- PMID: 26341298
- PMCID: PMC4831561
- DOI: 10.1093/molbev/msv185
Bayesian Inference Reveals Host-Specific Contributions to the Epidemic Expansion of Influenza A H5N1
Abstract
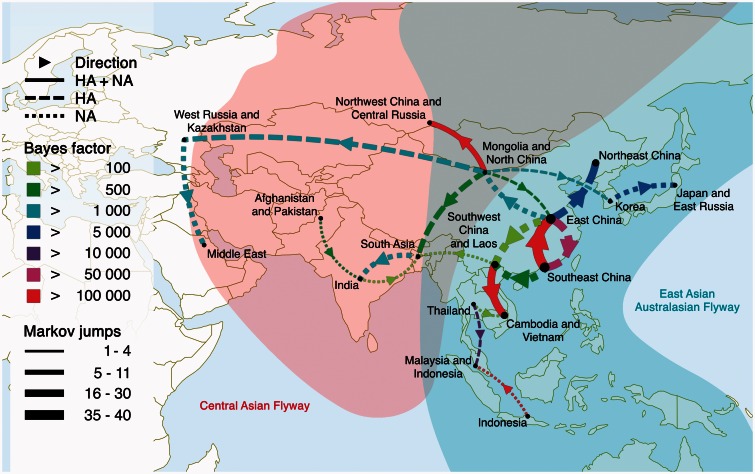
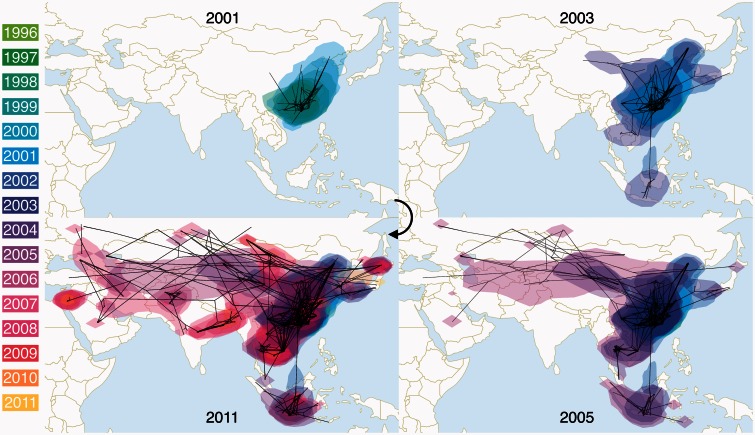
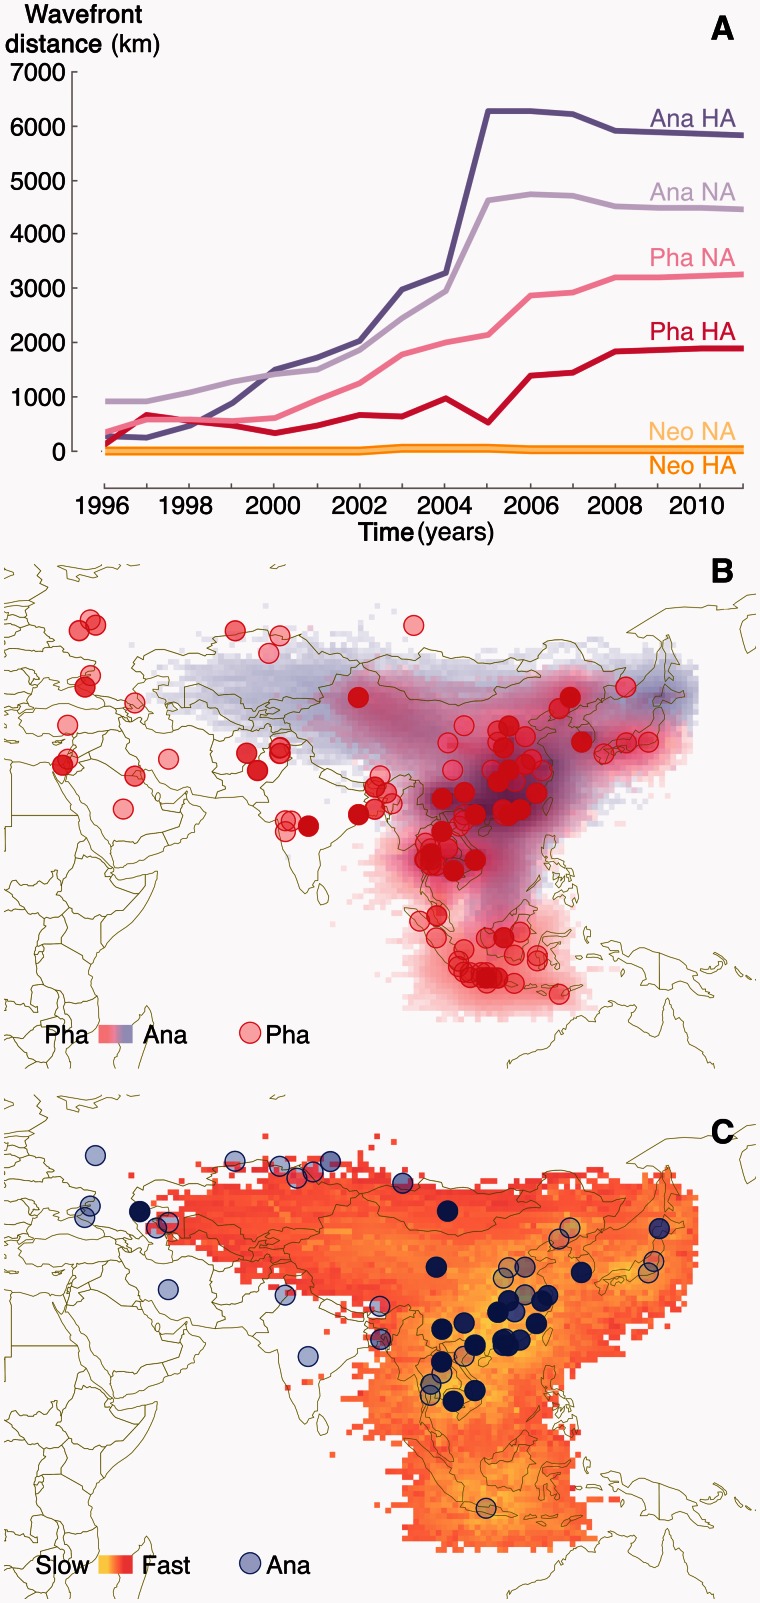
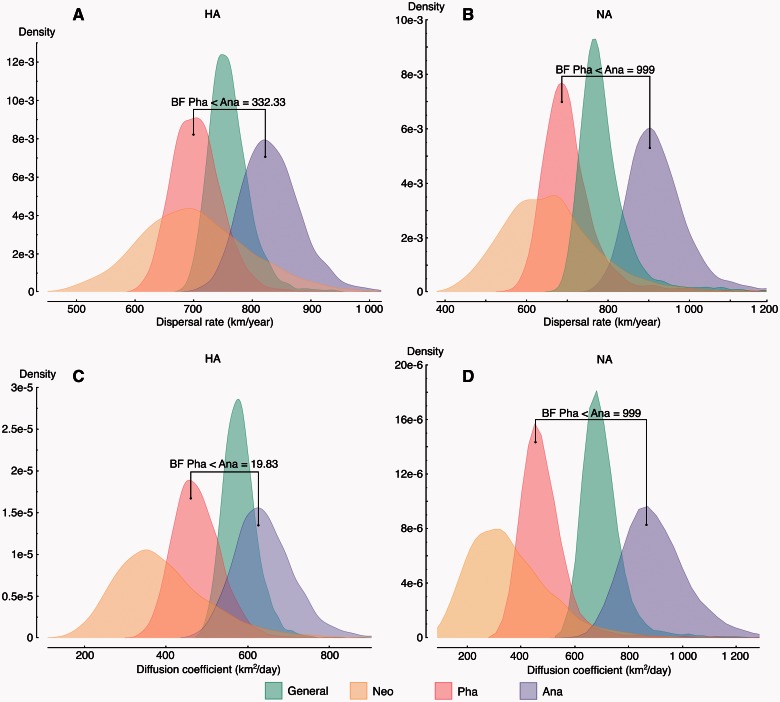
Since its first isolation in 1996 in Guangdong, China, the highly pathogenic avian influenza virus (HPAIV) H5N1 has circulated in avian hosts for almost two decades and spread to more than 60 countries worldwide. The role of different avian hosts and the domestic-wild bird interface has been critical in shaping the complex HPAIV H5N1 disease ecology, but remains difficult to ascertain. To shed light on the large-scale H5N1 transmission patterns and disentangle the contributions of different avian hosts on the tempo and mode of HPAIV H5N1 dispersal, we apply Bayesian evolutionary inference techniques to comprehensive sets of hemagglutinin and neuraminidase gene sequences sampled between 1996 and 2011 throughout Asia and Russia. Our analyses demonstrate that the large-scale H5N1 transmission dynamics are structured according to different avian flyways, and that the incursion of the Central Asian flyway specifically was driven by Anatidae hosts coinciding with rapid rate of spread and an epidemic wavefront acceleration. This also resulted in long-distance dispersal that is likely to be explained by wild bird migration. We identify a significant degree of asymmetry in the large-scale transmission dynamics between Anatidae and Phasianidae, with the latter largely representing poultry as an evolutionary sink. A joint analysis of host dynamics and continuous spatial diffusion demonstrates that the rate of viral dispersal and host diffusivity is significantly higher for Anatidae compared with Phasianidae. These findings complement risk modeling studies and satellite tracking of wild birds in demonstrating a continental-scale structuring into areas of H5N1 persistence that are connected through migratory waterfowl.
Keywords: Bayesian inference; H5N1; disease ecology; phylogeography; viral evolution.
© The Author 2015. Published by Oxford University Press on behalf of the Society for Molecular Biology and Evolution. All rights reserved. For permissions, please e-mail: journals.permissions@oup.com.
Figures
Similar articles
-
Avian influenza H5N1 viral and bird migration networks in Asia.Proc Natl Acad Sci U S A. 2015 Jan 6;112(1):172-7. doi: 10.1073/pnas.1405216112. Epub 2014 Dec 22. Proc Natl Acad Sci U S A. 2015. PMID: 25535385 Free PMC article.
-
Phylodynamics of H5N1 Highly Pathogenic Avian Influenza in Europe, 2005-2010: Potential for Molecular Surveillance of New Outbreaks.Viruses. 2015 Jun 23;7(6):3310-28. doi: 10.3390/v7062773. Viruses. 2015. PMID: 26110587 Free PMC article.
-
Flying over an infected landscape: distribution of highly pathogenic avian influenza H5N1 risk in South Asia and satellite tracking of wild waterfowl.Ecohealth. 2010 Dec;7(4):448-58. doi: 10.1007/s10393-010-0672-8. Epub 2011 Jan 26. Ecohealth. 2010. PMID: 21267626 Free PMC article.
-
Origin and evolution of highly pathogenic H5N1 avian influenza in Asia.Vet Rec. 2005 Aug 6;157(6):159-64. doi: 10.1136/vr.157.6.159. Vet Rec. 2005. PMID: 16085721 Review.
-
The genetics of highly pathogenic avian influenza viruses of subtype H5 in Germany, 2006-2020.Transbound Emerg Dis. 2021 May;68(3):1136-1150. doi: 10.1111/tbed.13843. Epub 2020 Sep 29. Transbound Emerg Dis. 2021. PMID: 32964686 Review.
Cited by
-
Disentangling the role of Africa in the global spread of H5 highly pathogenic avian influenza.Nat Commun. 2019 Nov 22;10(1):5310. doi: 10.1038/s41467-019-13287-y. Nat Commun. 2019. PMID: 31757953 Free PMC article.
-
Ecological divergence of wild birds drives avian influenza spillover and global spread.PLoS Pathog. 2022 May 19;18(5):e1010062. doi: 10.1371/journal.ppat.1010062. eCollection 2022 May. PLoS Pathog. 2022. PMID: 35588106 Free PMC article.
-
Genomic diversity and phylogeography of norovirus in China.BMC Med Genomics. 2017 Oct 3;10(Suppl 3):51. doi: 10.1186/s12920-017-0287-9. BMC Med Genomics. 2017. PMID: 28984198 Free PMC article.
-
The Evolutionary Dynamics of Influenza A Viruses Circulating in Mallards in Duck Hunting Preserves in Maryland, USA.Microorganisms. 2020 Dec 25;9(1):40. doi: 10.3390/microorganisms9010040. Microorganisms. 2020. PMID: 33375548 Free PMC article.
-
Habitat connectivity and host relatedness influence virus spread across an urbanising landscape in a fragmentation-sensitive carnivore.Virus Evol. 2022 Dec 21;9(1):veac122. doi: 10.1093/ve/veac122. eCollection 2023. Virus Evol. 2022. PMID: 36694819 Free PMC article.
References
-
- Baele G, Lemey P. 2013. Bayesian evolutionary model testing in the phylogenomics era: matching model complexity with computational efficiency. Bioinformatics 29(16):1970–1979. - PubMed
Publication types
MeSH terms
Grants and funding
LinkOut - more resources
Full Text Sources
Other Literature Sources
Medical
