. 2015 Sep 15;43(3):579-90.
doi: 10.1016/j.immuni.2015.08.006. Epub 2015 Sep 1.

Regulatory T Cells in Tumor-Associated Tertiary Lymphoid Structures Suppress Anti-tumor T Cell Responses

Affiliations

Regulatory T Cells in Tumor-Associated Tertiary Lymphoid Structures Suppress Anti-tumor T Cell Responses

Nikhil S Joshi et al. Immunity. .

Abstract

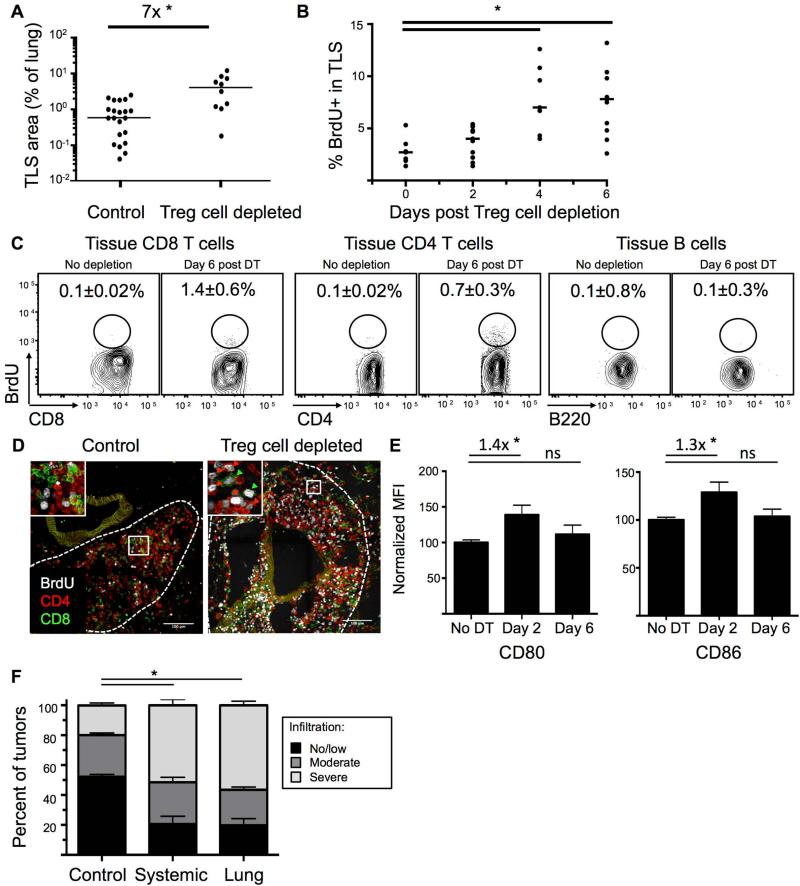
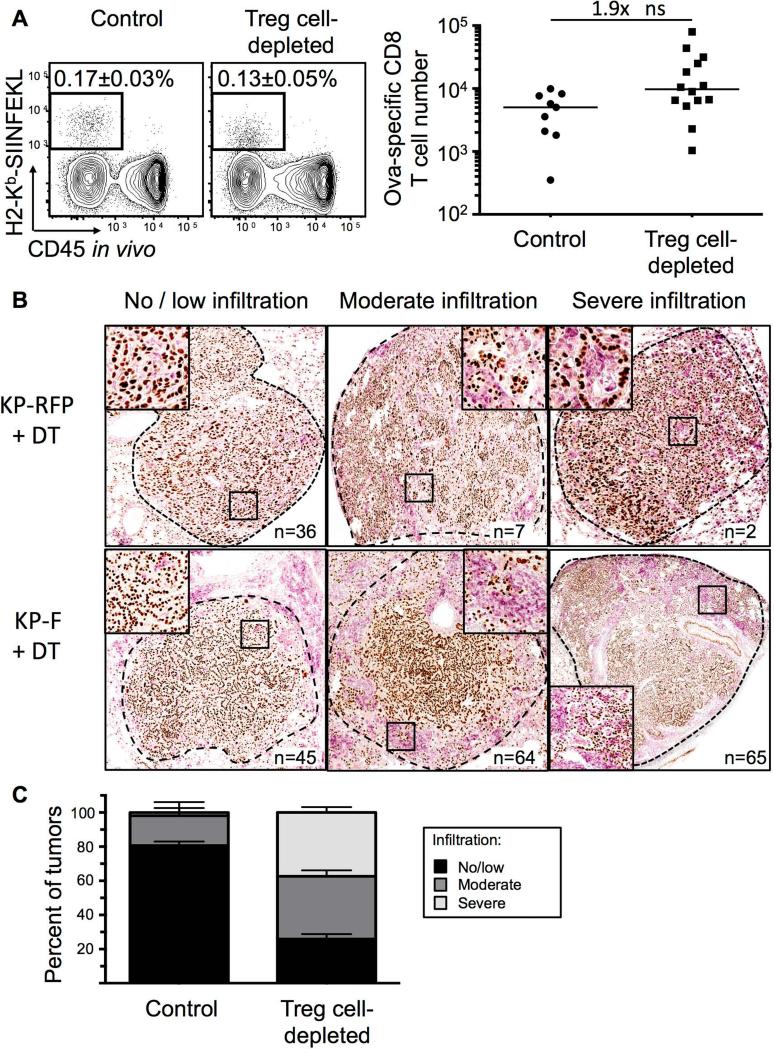
Infiltration of regulatory T (Treg) cells into many tumor types correlates with poor patient prognoses. However, mechanisms of intratumoral Treg cell function remain to be elucidated. We investigated Treg cell function in a genetically engineered mouse model of lung adenocarcinoma and found that Treg cells suppressed anti-tumor responses in tumor-associated tertiary lymphoid structures (TA-TLSs). TA-TLSs have been described in human lung cancers, but their function remains to be determined. TLSs in this model were spatially associated with >90% of tumors and facilitated interactions between T cells and tumor-antigen-presenting dendritic cells (DCs). Costimulatory ligand expression by DCs and T cell proliferation rates increased in TA-TLSs upon Treg cell depletion, leading to tumor destruction. Thus, we propose that Treg cells in TA-TLSs can inhibit endogenous immune responses against tumors, and targeting these cells might provide therapeutic benefit for cancer patients.


Figures

Figure 1
Figure 1. Treg cells in tumor-bearing lungs have an activated phenotype
KP-F and P-F (control) mice were analyzed ~20 wks (18-24 wks) after LucOS/Cre LV infection by flow cytometry. (A) FACS plots gated on lung CD4+ T cells. Tissue (black) and circulating (red) FoxP3+ Treg cell frequency indicated. Note, control and uninfected (naïve) lungs were indistinguishable. n > 30 mice. (B) Graph of total CD4 T cell and tissue and circulating Treg cell numbers in lungs from naïve (n=11) and tumor-bearing (20 wk, n=30) animals. Median and fold difference indicated. *, p = 0.03. (C) CD103 and KLRG1 on the Treg cell populations in 1A. n > 30 mice. (D) Expression of indicated markers by circulating DN (filled gray line) and tissue DN, SP, and DP Treg cells (red, dashed blue, and black lines, respectively). Gated as in 1C. n = 9-35 mice. (E) CTLA-4 expression by mLN (gray filled line), mesenteric (mes) LN (dashed blue line) and lung tissue Treg cells (black line). n = 7 mice.
Figure 2
Figure 2. Treg cells maintain immune quiescence in advanced tumors
~18-20-wk LucOS/Cre LV-infected KP-F (A) or KPT-F (B-H) mice were treated 1x (A) or 2x (B-H) with DT (IP; 50ng/g) and analyzed 2 (A) or 12 (B-H) days later. (A) FACS plots show lung CD4+ T cells, gated as in 1A. n > 6 mice. (B) Confocal IF images show range (no/low, moderate, or severe) of tumor destruction in untreated (left panel) and Treg cell-depleted (right 3 panels) mice. Red: tdTomato+; green: EpCAM; blue: Dapi; Dashed line: tumor border. (C) Quantitation of tumor destruction from images in 2C. n = 85/13 control and 108/17 Treg cell-depleted tumors/mice. (D) Control (left panels) and Treg cell-depleted (right panels) lungs were optically cleared using CLARITY. Images show optical slices through tumors. Red: tdTomato+; green: YO-PRO-1. See also Movie S1. n = 15/7 control and 10/3 Treg cell-depleted tumors/mice. (E) IHC images show control and Treg cell-depleted tumors for lung (NKX2.1, brown) and immune (CD45, pink) cells. n = 71/11 control and 55/9 Treg cell-depleted tumors/mice. (F) Graph of median lung-tissue CD4+ and CD8+ (Thy1.2+) T cell and (B220+ CD19+) B cell numbers in Treg cell-depleted (black bars, n=6) and control mice (white bars, n=5) ± SEM. *, p=0.0150. **, p=0.0175. (G) Confocal IF images show control (n=39) and Treg cell-depleted (n=15) tumors. Red: tdTomato+; green: CD4; blue: CD8 T cells. (H) Confocal IF image shows Treg cell-depleted tumor. Red: tdTomato+; green: CD11c+ macrophage (large round cells). Inset optical slice of macrophage with tdT+ vesicles (z-depth different than larger image). n = 4 mice.
Figure 3
Figure 3. Treg cells in tumor-bearing lungs are located in tumor-associated TLS
KP-F or KPT-F mice were analyzed 18-20 wks after LucOS/Cre LV infection. (A) IHC images show FoxP3 (black), hematoxylin (blue) and eosin (pink). Tumor, dashed line; TLS, solid line. Left panel, 4x. Right panel, 20x. n = 10 mice. (B) Median Treg cell number in tumor (n=88) and TLS (n=45) from 9 mice. Normalized by pixel area. *, p=3.89×10⁻²⁵. (C) IF image shows TLS. Red, CD11c; Green, FoxP3; Blue, B220; White, Dapi. n = 6 mice. (D) 3-D rendering of in silico reconstructed tumor-bearing lung lobe. ~20 IF sections (50μM, ~1 mm depth) imaged by confocal microscopy. Blue, NKX2.1; red, CD3; green, B220. Center panel same as left with NXK2.1 removed. Right panel, TLS in box. n = 3 mice. (E) Confocal IF images show TLS in serial stained sections (30 μm) stained for indicated markers. I, tumor, dashed line; TLS, solid line. n = 16 mice.
Figure 4
Figure 4. TLS serves as a local site of tumor antigen presentation
(A) Schematic diagram for B-F. In vitro-activated CT-670+ P14 and CT-V+ OT I Tg CD45.1+ CD8+ T cells were transferred into ~20-wk LucOS/Cre LV-infected CD45.2+ tumor-bearing KP-F and control P-F recipients. (B) FACS plots show lung CD45.1+ CD8+ P14 and OT-I T cells 2-3 days after transfer. n >12 per group. (C) Graph showing the median fraction (± SEM) of transferred OT-I (black bars, n = 620) or P14 (white bars, n = 238) CD8 T cells in the indicated tissue (see also Figure S5A). *, p = 1.89×10⁻³. **, p = 3.59×10⁻³. (D) Confocal IF images of TLS. Green: CT-V (OT-I T cells); blue: NKX2.1, and red: CD3 (left panel, n = 13) or CD11c (right panel, n >20). (E) Graph showing the mean fraction (± SEM) of OT-I (black bar, n = 231) or P14 (white bar, n = 122) T cells forming synapses (see also Figure S5B). *, p=5.62×10⁻¹¹. (F) FACS plots showing transferred P14 or OT-I CD8+ T cells (gated as in 5B). n >12 recipients. (G) Confocal IF image shows tumor/TLS in ~20 wk LucOS/Cre LV-infected KPT-F mouse. Green, CD3; cyan, CD11c (DCs are small cells); red, tdTomato. Note, signal intensity difference between tumor cells and DCs. n = 5 mice.
Figure 5
Figure 5. TLS is a site of immune activation following Treg cell depletion
~20-wk LucOS/Cre LV-infected KP-F mice were treated IP (A-F) or IT (F) with DT. (B-D) mice treated with BrdU to label proliferating cells. (A) Graph quantifying TLS / lung size of 22 control and 10 day-12 Treg cell-depleted mice. *, p=1.8×10⁻⁴. (B) Graph shows the percent of BrdU+ lymphocytes in TLS after Treg cell depletion. Day 0, no DT. Points are the average of lymphocytes in all the TLS in a section. Bar: median. See also Figure S6A. n=7, days 0 and 4 and n=11, days 2 and 6. *, p<0.005. (C) FACS plots show BrdU staining in lung-tissue CD8 and CD4 (FoxP3neg) T cells and B220+ CD19+ B cells. Average of 3 control and 6 Treg-depleted mice ± SEM. (D) Confocal IF images show control (n=18/9 TLS/mice) and day 6 Treg cell-depleted (n=57/12) TLS. Green, CD8; red, CD4; white, BrdU. Arrowheads: BrdU+ CD8 (green) and CD4 (red) T cells. (E) Graphs show median (± SEM) CD80 and CD86 MFI (median fluorescence intensity) on lung-tissue CD11b+ CD11c+ MHCII+ DCs. n=8, no DT; n=12, day 2; n=13, day 6 post DT. Fold change indicated. ns=non-significant. *, p<0.05. (F) Graph shows blind quantification of IHC on lung sections from control (n=630/23), day-12 IP DT treated (systemic depletion, n=136/15 tumors/mice), and day-12 IT DT treated (lung-restricted depletion, n=266/11) mice stained for CD45 and NKX2.1. no/little, < 30%; moderate 30-50%; severe, >50% CD45+ cell infiltration. *, p<0.005.
Figure 6
Figure 6. Overt antigen expression by tumors not required for anti-tumor response after Treg cell depletion
(A) FACS plots show and graph show endogenous ova-specific CD8+ T cells (identified with H2-Kb-SIINFEKL tetramer) in control (n=9) and day 12 Treg- depleted (IP; n=14) ~20-wk LucOS/Cre LV-infected KP-F mice. Plots gated on CD8+ T cells. Median frequency of total ± SEM indicated on plots. ns=non-significant. Note, no tetramer staining was observed in Cre LV-infected mice. (B) IHC images show NKX2.1 (brown) and CD45 (pink) in ~18-wk Cre LV-infected KP-F (n=15) and KP-RFP (control, n=6) mice 12 days after IP DT. no/little, < 30%; moderate 30-50%; severe, >50% CD45+ cell infiltration. n = tumor number. (C) Graph quantifying IHC in 6B. Control includes tumors from DT-treated KP RFP (n= 45 tumors/6 mice) and untreated KP-F (n=58 tumors/5 mice). n = 174 Treg cell-depleted tumors from 10 mice.

Comment in

References

    1. Aleksic M, Liddy N, Molloy PE, Pumphrey N, Vuidepot A, Chang KM, Jakobsen BK. Different affinity windows for virus and cancer-specific T-cell receptors: implications for therapeutic strategies. European journal of immunology. 2012;42:3174–3179. - PMC - PubMed
    1. Antonioli L, Pacher P, Vizi ES, Hasko G. CD39 and CD73 in immunity and inflammation. Trends in molecular medicine. 2013;19:355–367. - PMC - PubMed
    1. Beyersdorf N, Ding X, Tietze JK, Hanke T. Characterization of mouse CD4 T cell subsets defined by expression of KLRG1. European journal of immunology. 2007;37:3445–3454. - PubMed
    1. Billadeau DD, Nolz JC, Gomez TS. Regulation of T-cell activation by the cytoskeleton. Nature reviews. 2007;7:131–143. - PubMed
    1. Boissonnas A, Scholer-Dahirel A, Simon-Blancal V, Pace L, Valet F, Kissenpfennig A, Sparwasser T, Malissen B, Fetler L, Amigorena S. Foxp3+ T cells induce perforin-dependent dendritic cell death in tumor-draining lymph nodes. Immunity. 2010;32:266–278. - PubMed

Publication types

MeSH terms

Substances

LinkOut - more resources