

The Genetic Architecture of Hearing Impairment in Mice: Evidence for Frequency-Specific Genetic Determinants
- PMID: 26342000
- PMCID: PMC4632053
- DOI: 10.1534/g3.115.021592
The Genetic Architecture of Hearing Impairment in Mice: Evidence for Frequency-Specific Genetic Determinants
Abstract
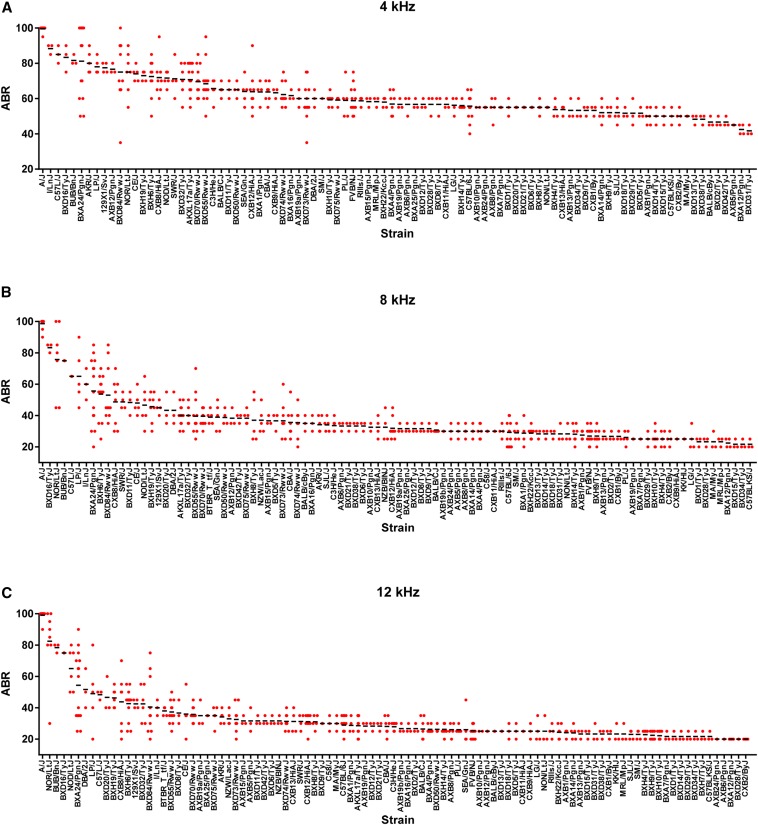
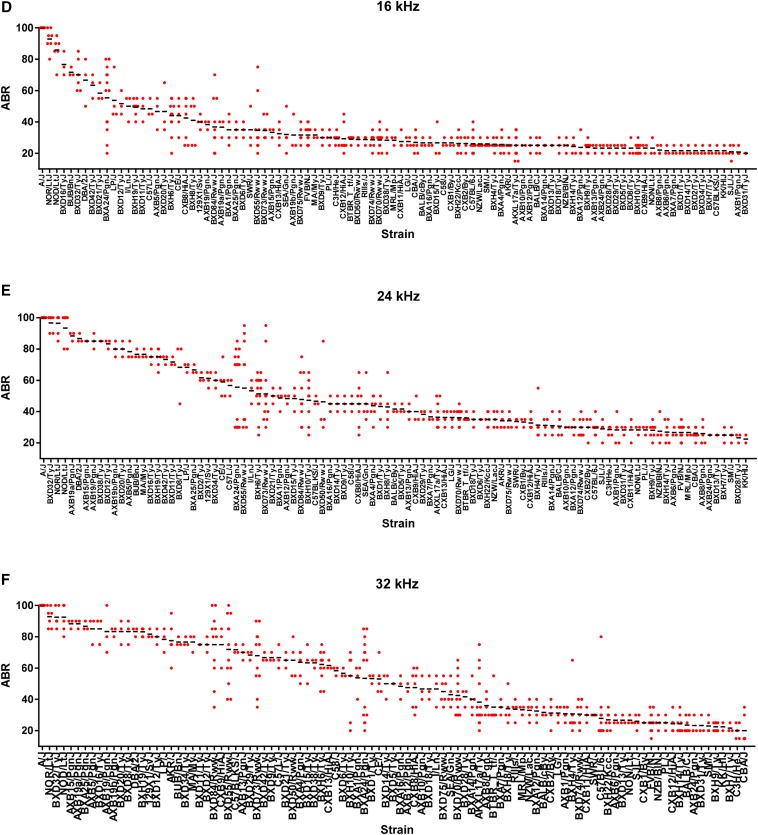
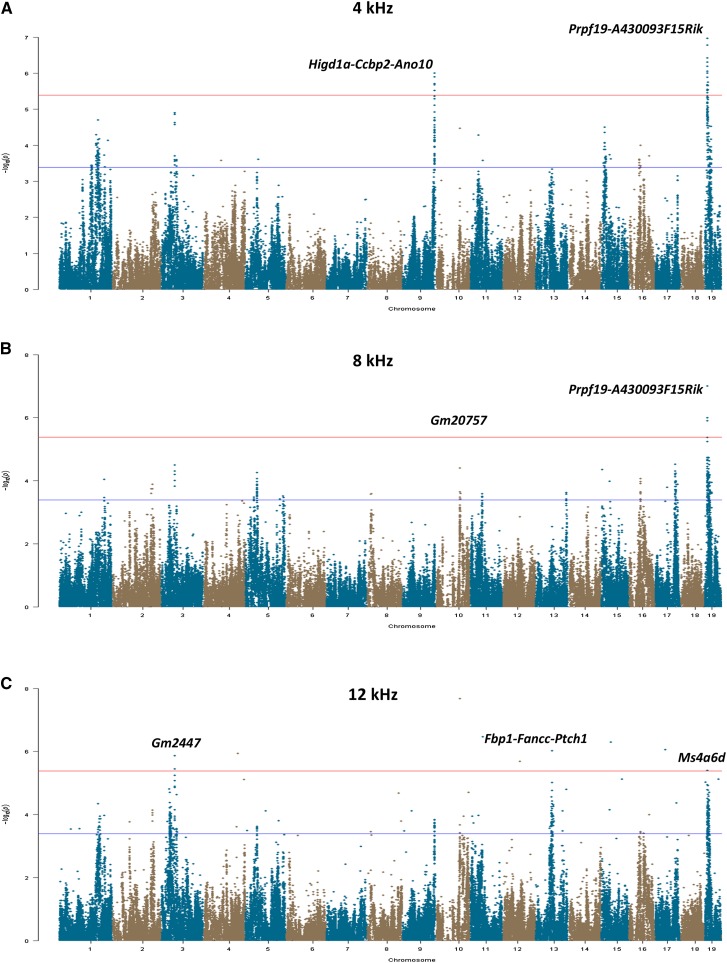
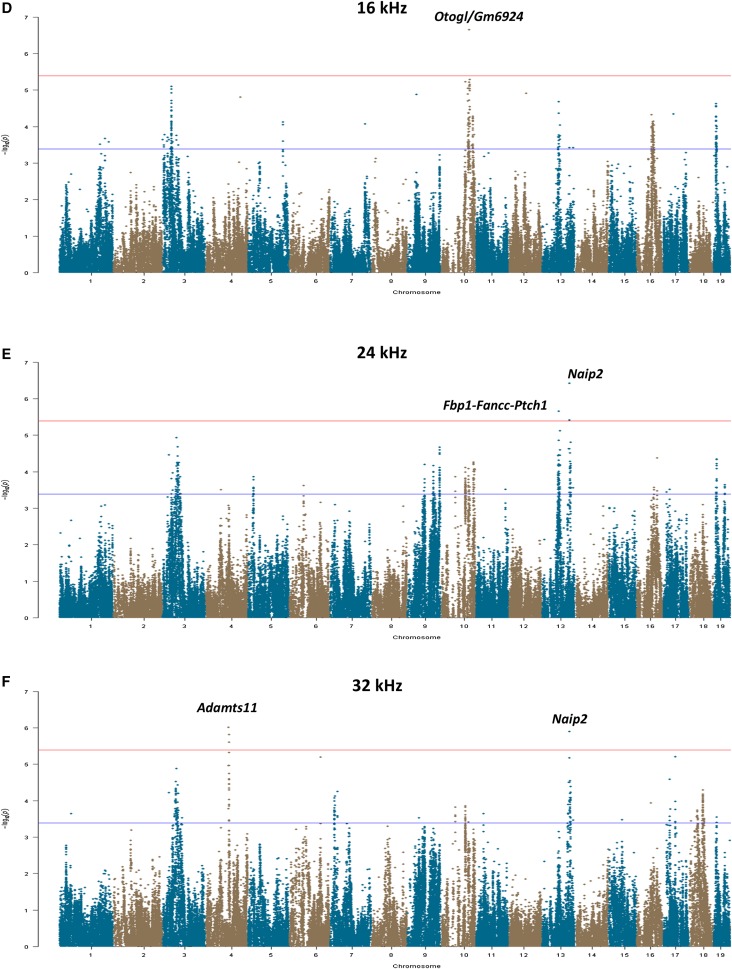
Genome-wide association studies (GWAS) have been successfully applied in humans for the study of many complex phenotypes. However, identification of the genetic determinants of hearing in adults has been hampered, in part, by the relative inability to control for environmental factors that might affect hearing throughout the lifetime, as well as a large degree of phenotypic heterogeneity. These and other factors have limited the number of large-scale studies performed in humans that have identified candidate genes that contribute to the etiology of this complex trait. To address these limitations, we performed a GWAS analysis using a set of inbred mouse strains from the Hybrid Mouse Diversity Panel. Among 99 strains characterized, we observed approximately two-fold to five-fold variation in hearing at six different frequencies, which are differentiated biologically from each other by the location in the cochlea where each frequency is registered. Among all frequencies tested, we identified a total of nine significant loci, several of which contained promising candidate genes for follow-up study. Taken together, our results indicate the existence of both genes that affect global cochlear function, as well as anatomical- and frequency-specific genes, and further demonstrate the complex nature of mammalian hearing variation.
Keywords: ABR; Hybrid Mouse Diversity Panel (HMDP); cochlear function; genetics; genome-wide association study (GWAS); genomics; hearing.
Copyright © 2015 Crow et al.
Figures
Similar articles
-
The Genetic Architecture of Noise-Induced Hearing Loss: Evidence for a Gene-by-Environment Interaction.G3 (Bethesda). 2016 Oct 13;6(10):3219-3228. doi: 10.1534/g3.116.032516. G3 (Bethesda). 2016. PMID: 27520957 Free PMC article.
-
A novel QTL underlying early-onset, low-frequency hearing loss in BXD recombinant inbred strains.Genes Brain Behav. 2012 Nov;11(8):911-20. doi: 10.1111/j.1601-183X.2012.00845.x. Epub 2012 Oct 8. Genes Brain Behav. 2012. PMID: 22989164
-
Hearing loss and tinnitus: association studies for complex-hearing disorders in mouse and man.Hum Genet. 2022 Apr;141(3-4):981-990. doi: 10.1007/s00439-021-02317-9. Epub 2021 Jul 27. Hum Genet. 2022. PMID: 34318347 Free PMC article. Review.
-
Extreme-phenotype genome-wide association study (XP-GWAS): a method for identifying trait-associated variants by sequencing pools of individuals selected from a diversity panel.Plant J. 2015 Nov;84(3):587-96. doi: 10.1111/tpj.13029. Plant J. 2015. PMID: 26386250
-
Genetic influences on susceptibility of the auditory system to aging and environmental factors.Scand Audiol Suppl. 1992;36:1-39. Scand Audiol Suppl. 1992. PMID: 1488615 Review.
Cited by
-
Age-related hearing loss: Unraveling the pieces.Laryngoscope Investig Otolaryngol. 2018 Feb 21;3(2):68-72. doi: 10.1002/lio2.134. eCollection 2018 Apr. Laryngoscope Investig Otolaryngol. 2018. PMID: 29721536 Free PMC article. Review.
-
The Hybrid Mouse Diversity Panel: a resource for systems genetics analyses of metabolic and cardiovascular traits.J Lipid Res. 2016 Jun;57(6):925-42. doi: 10.1194/jlr.R066944. Epub 2016 Apr 19. J Lipid Res. 2016. PMID: 27099397 Free PMC article. Review.
-
The Genetics of Variation of the Wave 1 Amplitude of the Mouse Auditory Brainstem Response.J Assoc Res Otolaryngol. 2020 Aug;21(4):323-336. doi: 10.1007/s10162-020-00762-3. Epub 2020 Aug 5. J Assoc Res Otolaryngol. 2020. PMID: 32757112 Free PMC article.
-
A requirement for Fgfr2 in middle ear development.Genesis. 2019 Jan;57(1):e23252. doi: 10.1002/dvg.23252. Epub 2018 Oct 4. Genesis. 2019. PMID: 30253032 Free PMC article.
-
Application of Mouse Models to Research in Hearing and Balance.J Assoc Res Otolaryngol. 2016 Dec;17(6):493-523. doi: 10.1007/s10162-016-0589-1. Epub 2016 Oct 17. J Assoc Res Otolaryngol. 2016. PMID: 27752925 Free PMC article. Review.
References
-
- Bonnet C., Louha M., Loundon N., Michalski N., Verpy E., et al. , 2013. Biallelic nonsense mutations in the otogelin-like gene (OTOGL) in a child affected by mild to moderate hearing impairment. Gene 527: 537–540. - PubMed
-
- Davis R. L., 2003. Gradients of neurotrophins, ion channels, and tuning in the cochlea. Neuroscientist 9: 311–316. - PubMed
Publication types
MeSH terms
Grants and funding
- R01 ES021801/ES/NIEHS NIH HHS/United States
- P30 ES007048/ES/NIEHS NIH HHS/United States
- P01HL30568/HL/NHLBI NIH HHS/United States
- R01ES021801/ES/NIEHS NIH HHS/United States
- T32ES013678/ES/NIEHS NIH HHS/United States
- P01 HL028481/HL/NHLBI NIH HHS/United States
- 3R01ES021801-03S1/ES/NIEHS NIH HHS/United States
- P30ES007048/ES/NIEHS NIH HHS/United States
- R01DC010856/DC/NIDCD NIH HHS/United States
- R01ES022282/ES/NIEHS NIH HHS/United States
- UL1TR000130/TR/NCATS NIH HHS/United States
- T32 ES013678/ES/NIEHS NIH HHS/United States
- P01HL28481/HL/NHLBI NIH HHS/United States
- R01 ES022282/ES/NIEHS NIH HHS/United States
- R01 ES025786/ES/NIEHS NIH HHS/United States
- P01 HL030568/HL/NHLBI NIH HHS/United States
- R01 DC010856/DC/NIDCD NIH HHS/United States
- R01ES025786/ES/NIEHS NIH HHS/United States
- UL1 TR000130/TR/NCATS NIH HHS/United States
LinkOut - more resources
Full Text Sources
Other Literature Sources
Molecular Biology Databases