

A Novel Type Pathway-Specific Regulator and Dynamic Genome Environments of a Solanapyrone Biosynthesis Gene Cluster in the Fungus Ascochyta rabiei
- PMID: 26342019
- PMCID: PMC4621316
- DOI: 10.1128/EC.00084-15
A Novel Type Pathway-Specific Regulator and Dynamic Genome Environments of a Solanapyrone Biosynthesis Gene Cluster in the Fungus Ascochyta rabiei
Abstract
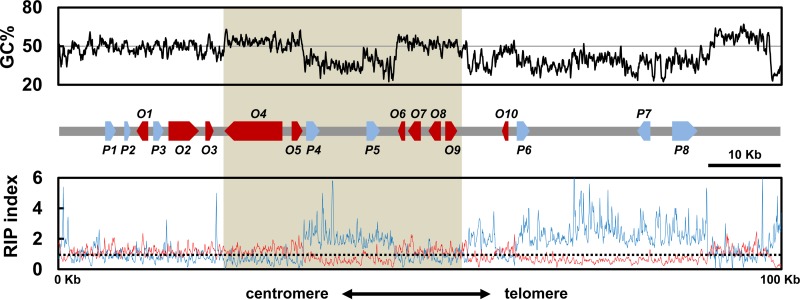
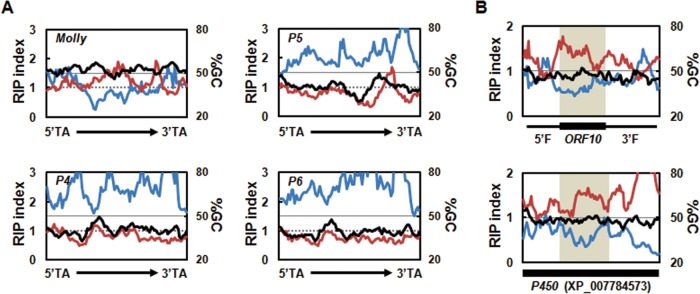
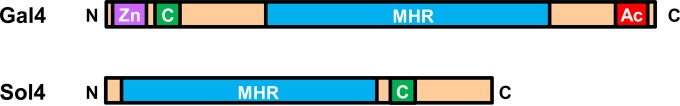
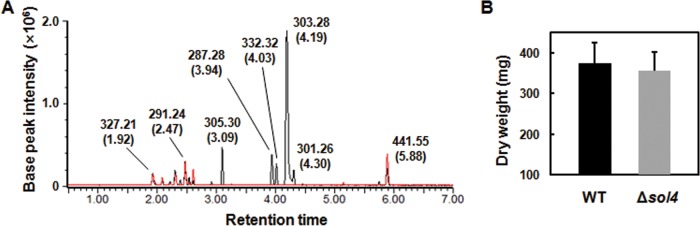
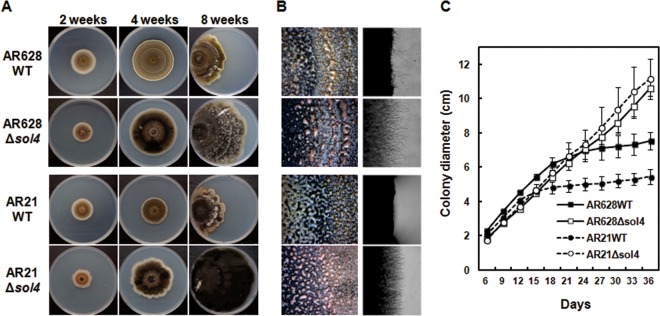
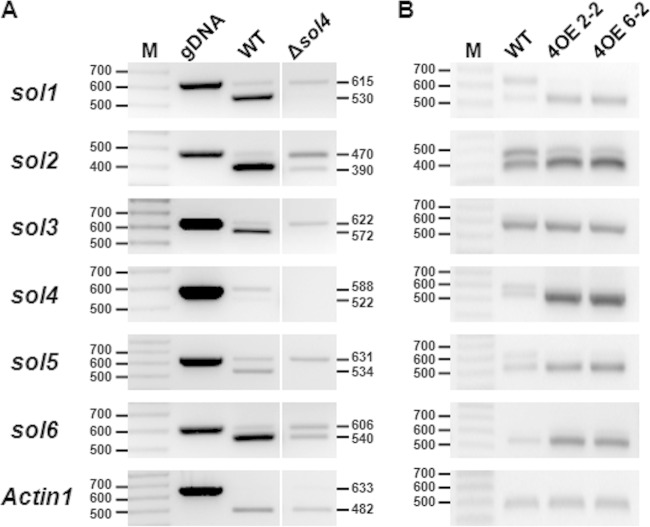
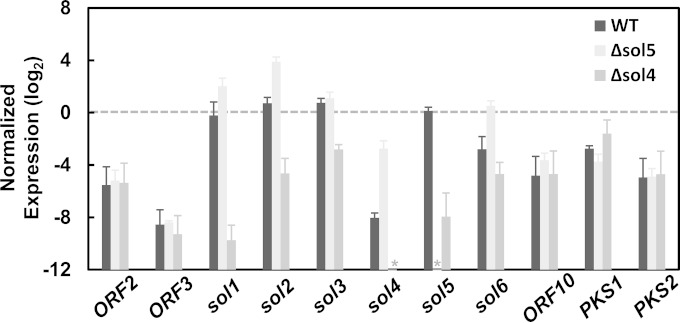
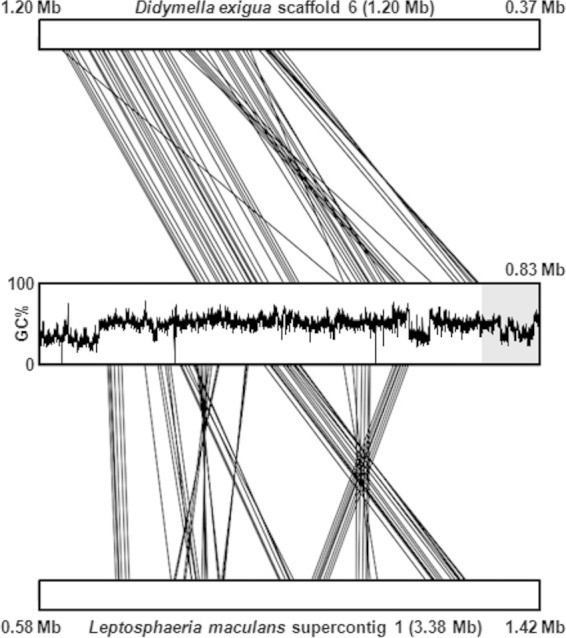
Secondary metabolite genes are often clustered together and situated in particular genomic regions, like the subtelomere, that can facilitate niche adaptation in fungi. Solanapyrones are toxic secondary metabolites produced by fungi occupying different ecological niches. Full-genome sequencing of the ascomycete Ascochyta rabiei revealed a solanapyrone biosynthesis gene cluster embedded in an AT-rich region proximal to a telomere end and surrounded by Tc1/Mariner-type transposable elements. The highly AT-rich environment of the solanapyrone cluster is likely the product of repeat-induced point mutations. Several secondary metabolism-related genes were found in the flanking regions of the solanapyrone cluster. Although the solanapyrone cluster appears to be resistant to repeat-induced point mutations, a P450 monooxygenase gene adjacent to the cluster has been degraded by such mutations. Among the six solanapyrone cluster genes (sol1 to sol6), sol4 encodes a novel type of Zn(II)2Cys6 zinc cluster transcription factor. Deletion of sol4 resulted in the complete loss of solanapyrone production but did not compromise growth, sporulation, or virulence. Gene expression studies with the sol4 deletion and sol4-overexpressing mutants delimited the boundaries of the solanapyrone gene cluster and revealed that sol4 is likely a specific regulator of solanapyrone biosynthesis and appears to be necessary and sufficient for induction of the solanapyrone cluster genes. Despite the dynamic surrounding genomic regions, the solanapyrone gene cluster has maintained its integrity, suggesting important roles of solanapyrones in fungal biology.
Copyright © 2015, American Society for Microbiology. All Rights Reserved.
Figures
Similar articles
-
Functional Analyses of the Diels-Alderase Gene sol5 of Ascochyta rabiei and Alternaria solani Indicate that the Solanapyrone Phytotoxins Are Not Required for Pathogenicity.Mol Plant Microbe Interact. 2015 Apr;28(4):482-96. doi: 10.1094/MPMI-08-14-0234-R. Mol Plant Microbe Interact. 2015. PMID: 25372118
-
Production of Ascochyta rabiei lacking solanapyrone A toxin production.Commun Agric Appl Biol Sci. 2010;75(4):601-5. Commun Agric Appl Biol Sci. 2010. PMID: 21534467
-
Production of the antibiotic secondary metabolite solanapyrone A by the fungal plant pathogen Ascochyta rabiei during fruiting body formation in saprobic growth.Environ Microbiol. 2017 May;19(5):1822-1835. doi: 10.1111/1462-2920.13673. Epub 2017 Feb 6. Environ Microbiol. 2017. PMID: 28109049
-
Ascochyta blight of chickpea: production of phytotoxins and disease management.Biotechnol Adv. 2008 Nov-Dec;26(6):511-5. doi: 10.1016/j.biotechadv.2008.06.001. Epub 2008 Jun 22. Biotechnol Adv. 2008. PMID: 18616995 Review.
-
Phytotoxic Metabolites Produced by Legume-Associated Ascochyta and Its Related Genera in the Dothideomycetes.Toxins (Basel). 2019 Oct 29;11(11):627. doi: 10.3390/toxins11110627. Toxins (Basel). 2019. PMID: 31671808 Free PMC article. Review.
Cited by
-
Ascochyta rabiei: A threat to global chickpea production.Mol Plant Pathol. 2022 Sep;23(9):1241-1261. doi: 10.1111/mpp.13235. Epub 2022 Jul 1. Mol Plant Pathol. 2022. PMID: 35778851 Free PMC article. Review.
-
Current population structure and pathogenicity patterns of Ascochyta rabiei in Australia.Microb Genom. 2021 Jul;7(7):000627. doi: 10.1099/mgen.0.000627. Microb Genom. 2021. PMID: 34283013 Free PMC article.
-
Discovery, Biosynthesis, Total Synthesis, and Biological Activities of Solanapyrones: [4 + 2] Cycloaddition-Derived Polyketides of Fungal Origin.J Nat Prod. 2024 Dec 27;87(12):2892-2906. doi: 10.1021/acs.jnatprod.4c00818. Epub 2024 Nov 15. J Nat Prod. 2024. PMID: 39545605 Free PMC article. Review.
-
Reference Genome Assembly for Australian Ascochyta rabiei Isolate ArME14.G3 (Bethesda). 2020 Jul 7;10(7):2131-2140. doi: 10.1534/g3.120.401265. G3 (Bethesda). 2020. PMID: 32345704 Free PMC article.
-
Linking a Gene Cluster to Atranorin, a Major Cortical Substance of Lichens, through Genetic Dereplication and Heterologous Expression.mBio. 2021 Jun 29;12(3):e0111121. doi: 10.1128/mBio.01111-21. Epub 2021 Jun 22. mBio. 2021. PMID: 34154413 Free PMC article.
References
-
- Fedorova ND, Khaldi N, Joardar VS, Maiti R, Amedeo P, Anderson MJ, Crabtree J, Silva JC, Badger JH, Albarraq A, Angiuoli S, Bussey H, Bowyer P, Cotty PJ, Dyer PS, Egan A, Galens K, Fraser-Liggett CM, Haas BJ, Inman JM, Kent R, Lemieux S, Malavazi I, Orvis J, Roemer T, Ronning CM, Sundaram JP, Sutton G, Turner G, Venter JC, White OR, Whitty BR, Youngman P, Wolfe KH, Goldman GH, Wortman JR, Jiang B, Denning DW, Nierman WC. 2008. Genomic islands in the pathogenic filamentous fungus Aspergillus fumigatus. PLoS Genet 4:e1000046. doi:10.1371/journal.pgen.1000046. - DOI - PMC - PubMed
-
- Galagan JE, Calvo SE, Cuomo C, Ma L-J, Wortman JR, Batzoglou S, Lee S-I, Basturkmen M, Spevak CC, Clutterbuck J, Kapitonov V, Jurka J, Scazzocchio C, Farman M, Butler J, Purcell S, Harris S, Braus GH, Draht O, Busch S, D'Enfert C, Bouchier C, Goldman GH, Bell-Pedersen D, Griffiths-Jones S, Doonan JH, Yu J, Vienken K, Pain A, Freitag M, Selker EU, Archer DB, Penalva MA, Oakley BR, Momany M, Tanaka T, Kumagai T, Asai K, Machida M, Nierman WC, Denning DW, Caddick M, Hynes M, Paoletti M, Fischer R, Miller B, Dyer P, Sachs MS, Osmani SA, Birren BW. 2005. Sequencing of Aspergillus nidulans and comparative analysis with A. fumigatus and A. oryzae. Nature 438:1105–1115. doi:10.1038/nature04341. - DOI - PubMed
-
- Berriman M, Hall N, Sheader K, Bringaud F, Tiwari B, Isobe T, Bowman S, Corton C, Clark L, Cross GAM, Hoek M, Zanders T, Berberof M, Borst P, Rudenko G. 2002. The architecture of variant surface glycoprotein gene expression sites in Trypanosoma brucei. Mol Biochem Parasitol 122:131–140. doi:10.1016/S0166-6851(02)00092-0. - DOI - PubMed
Publication types
MeSH terms
Substances
LinkOut - more resources
Full Text Sources
