. 2015 Oct 23;290(43):26125-40.
doi: 10.1074/jbc.M115.651489. Epub 2015 Sep 4.

Binding of Galectin-3, a β-Galactoside-binding Lectin, to MUC1 Protein Enhances Phosphorylation of Extracellular Signal-regulated Kinase 1/2 (ERK1/2) and Akt, Promoting Tumor Cell Malignancy

Affiliations

Binding of Galectin-3, a β-Galactoside-binding Lectin, to MUC1 Protein Enhances Phosphorylation of Extracellular Signal-regulated Kinase 1/2 (ERK1/2) and Akt, Promoting Tumor Cell Malignancy

Yugo Mori et al. J Biol Chem. .

Abstract

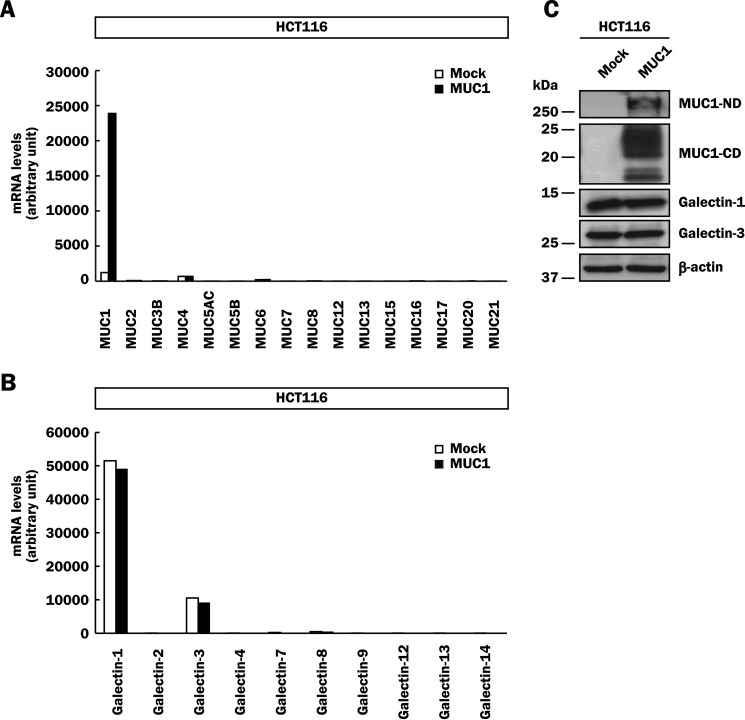
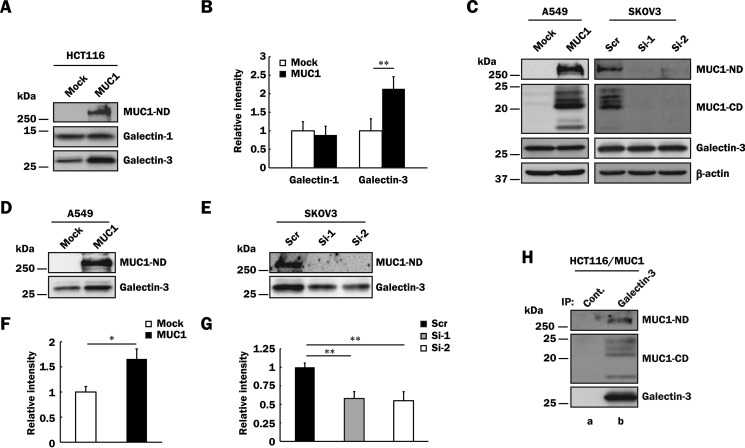
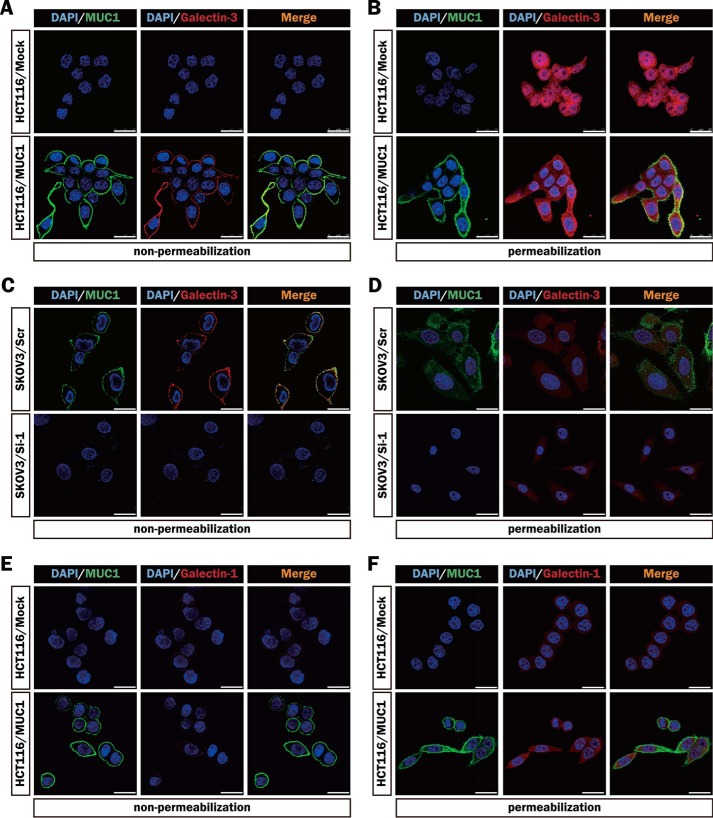
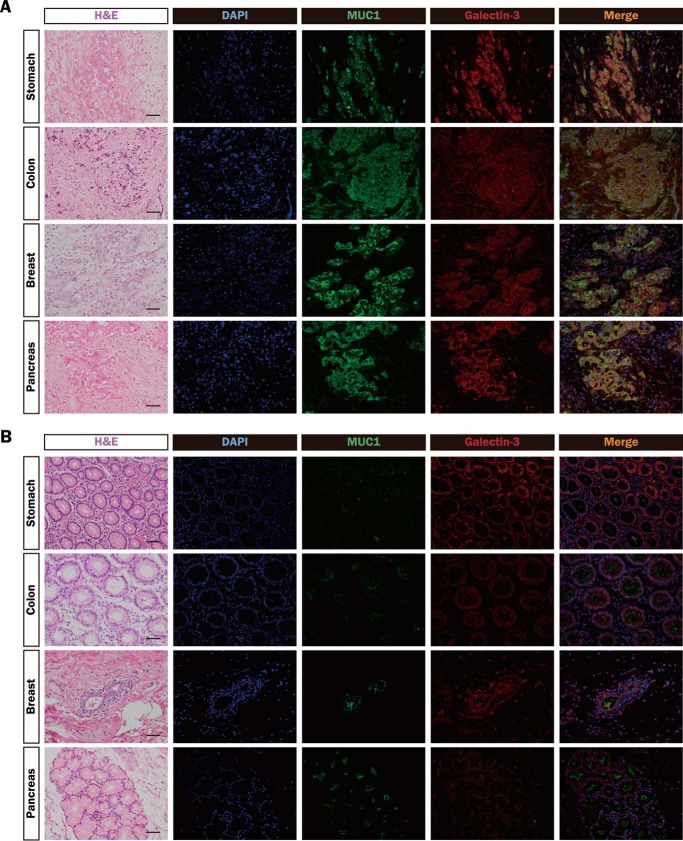
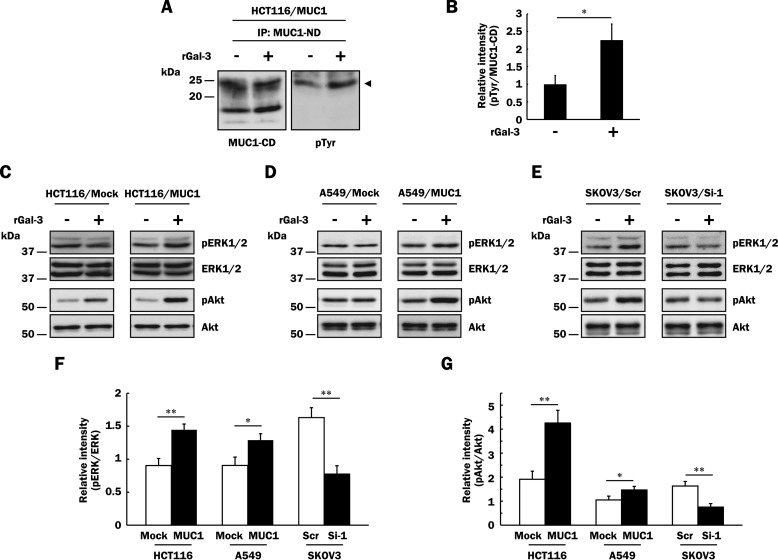
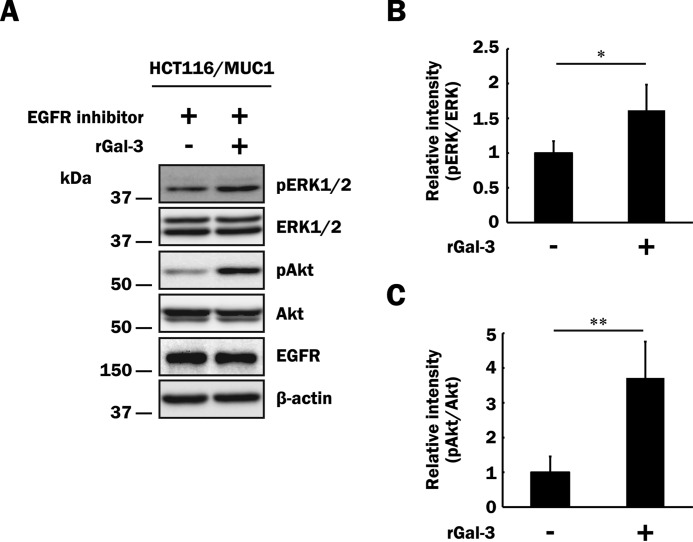
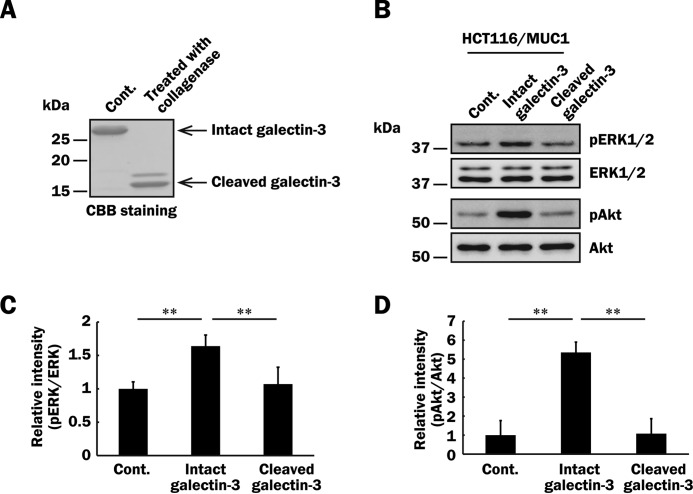
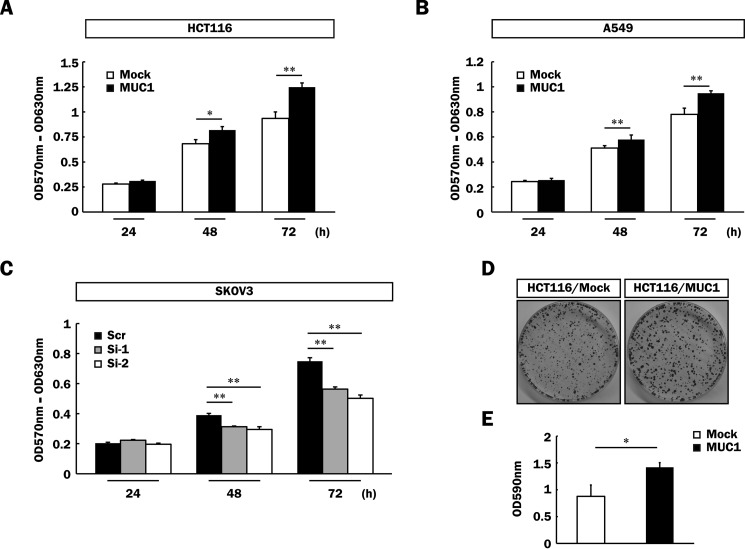
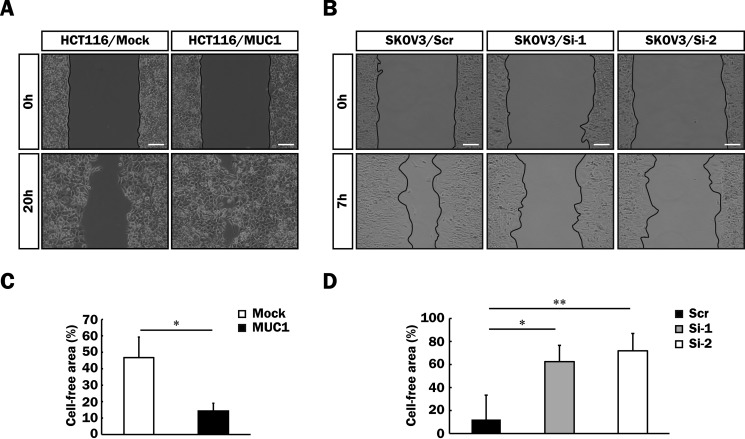
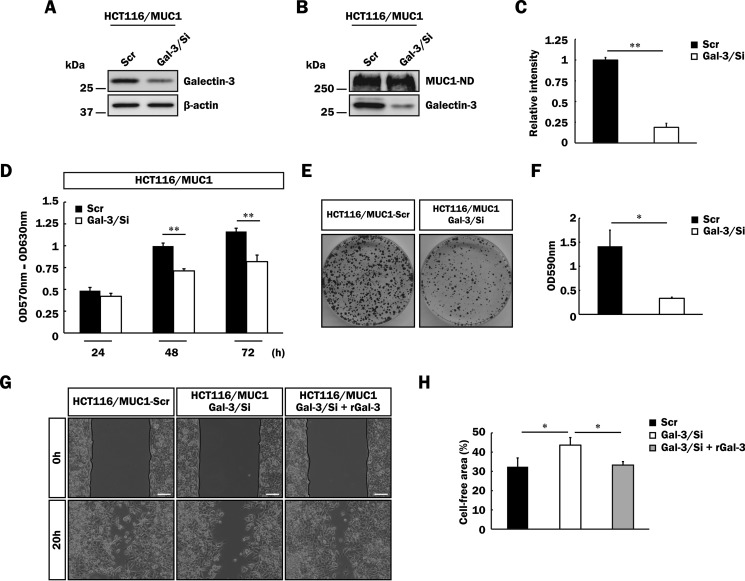
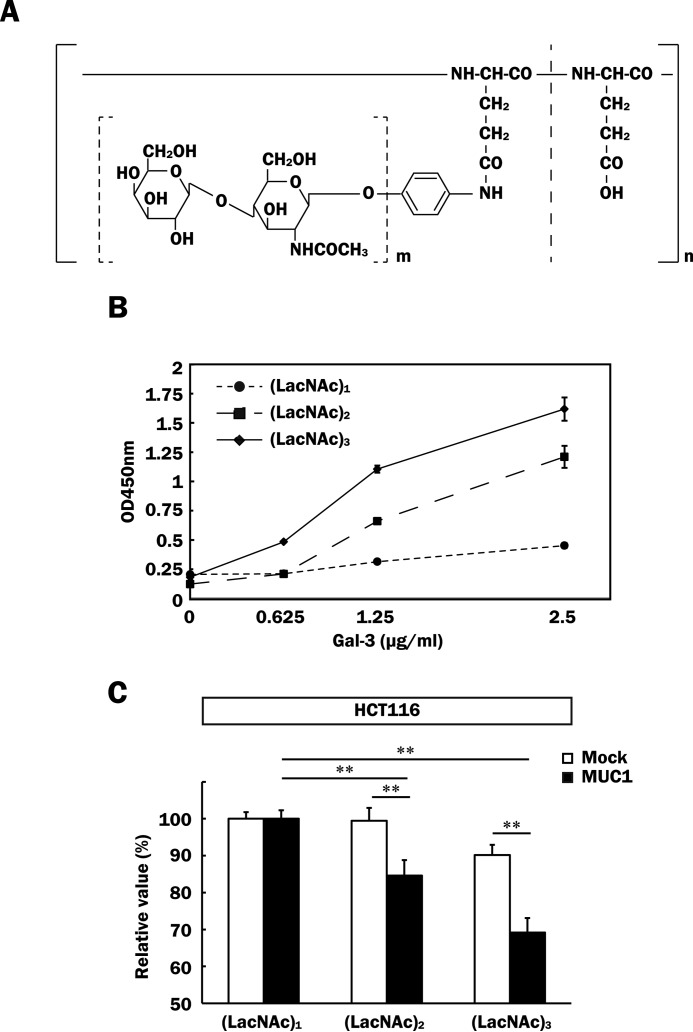
Both mucin 1 (MUC1) and galectin-3 are known to be overexpressed in various malignant tumors and associated with a poor prognosis. It has been extensively reported that MUC1 is involved in potentiation of growth factor-dependent signal transduction. Because some carbohydrate moieties carried on MUC1 change to preferable ones for binding of galectin-3 in cancer cells, we speculated that MUC1-mediated signaling may occur through direct binding of galectin-3. Immunochemical studies showed that the distribution of galectin-3 coincided with that of MUC1 in various human tumor tissues but not in human nonmalignant tissues, and the level of galectin-3 retained on the surface of various cancer cells paralleled that of MUC1. Treatment of MUC1-expressing cells with galectin-3 induced phosphorylation of ERK1/2 and Akt following enhanced phosphorylation of MUC1 C-terminal domain, consistently promoting tumor cell malignancy. It is also noted that this enhanced phosphorylation occurred independently of EGF receptor-mediated signaling in both EGF receptor- and MUC1-expressing cells, and multivalency of galectin-3 was important for initiation of MUC1-mediated signaling. Expectedly, both silencing of endogenous galectin-3 and treatment with galectin-3 antagonists down-regulated cell proliferation of MUC1-expressing cells. These results suggest that the binding of galectin-3 to MUC1 plays a key role in MUC1-mediated signaling. Thus, constitutive activation of MUC1-mediated signaling in an autocrine/paracrine manner caused by ligation of galectin-3 promotes uncontrolled tumor cell malignancy. This signaling may be another MUC1-mediated pathway and function in parallel with a growth factor-dependent MUC1-mediated signaling pathway.

Keywords: cancer; cell motility; cell proliferation; galectin-3; mucin 1, cell surface-associated (MUC1); signal transduction.


Figures

FIGURE 1.
FIGURE 1.
Expression of the mucin and galectin family in HCT116 cells. A and B, mRNA levels of the mucin (A) and galectin (B) family in HCT116/Mock and HCT116/MUC1 cells were determined by DNA microarray analysis. C, lysates of HCT116/Mock and HCT116/MUC1 cells were subjected to SDS-PAGE, followed by Western blotting and detection with anti-MUC1-ND, anti-MUC1-CD, anti-galectin-1, anti-galectin-3, and anti-β-actin antibodies. β-Actin was used as a loading control.
FIGURE 2.
FIGURE 2.
Binding of galectin-3 to MUC1 in various MUC1-expressing cells. A, HCT116/Mock and HCT116/MUC1 cells were treated with biotin as described under “Experimental Procedures,” and the cell surface proteins were precipitated from the lysates with streptavidin-Sepharose. The precipitates were subjected to SDS-PAGE, followed by Western blotting and detection with anti-MUC1-ND, anti-galectin-1, and anti-galectin-3 antibodies. B, the levels of galectin-1 and -3 on the cell surface were determined by measuring the intensities of their bands in Fig. 2A with ImageJ. The respective intensities of galectin-1 and -3 in control cells were taken as 1 (means ± S.D., n = 3). **, p < 0.01. C, lysates of A549/Mock, A549/MUC1, SKOV3/Scr, SKOV3/Si-1, and SKOV3/Si-2 cells were subjected to SDS-PAGE, followed by Western blotting as described in Fig. 1C. β-Actin was used as a loading control. D and E, A549/Mock, A549/MUC1 (D), SKOV3/Scr, SKOV3/Si-1, and SKOV3/Si-2 (E) cells were labeled with biotin, and then MUC1-ND and galectin-3 on the cell surface were detected as described in Fig. 2A. F and G, the intensity of galectin-3 in Fig. 2 (D and E) was determined and normalized as described in Fig. 2B (means ± S.D., n = 3). *, p < 0.05; **, p < 0.01. H, galectin-3 was immunoprecipitated (IP) from lysates of HCT116/MUC1 cells with anti-galectin-3 antibodies (lane b) or control IgG (lane a) and then subjected to SDS-PAGE, followed by Western blotting and detection with anti-MUC1-ND, anti-MUC1-CD, and anti-galectin-3 antibodies.
FIGURE 3.
FIGURE 3.
Distributions of MUC1, galectin-3, and galectin-1 in various MUC1-expressing cells. A, C, and E, MUC1 and galectin-3 on the surface of HCT116/Mock, HCT116/MUC1 (A), SKOV3/Scr, and SKOV3/Si-1 (C) cells, or MUC1 and galectin-1 on the surface of HCT116/Mock and HCT116/MUC1 (E) cells were detected immunocytochemically using the combinations of anti-MUC1-ND and Alexa Fluor 488-conjugated secondary antibodies (green), and anti-galectin-3 or anti-galectin-1 and Alexa Fluor 594-conjugated secondary antibodies (red), respectively. B, D, and F, after the cells had been permeabilized as described under “Experimental Procedures,” MUC1 and galectin-3 in HCT116/Mock, HCT116/MUC1 (B), SKOV3/Scr and SKOV3/Si-1 (D) cells, or MUC1 and galectin-1 in HCT116/Mock and HCT116/MUC1 (F) cells were detected as described above. The nuclei were stained with DAPI (blue). Image magnification is ×630. Scale bars, 25 μm.
FIGURE 4.
FIGURE 4.
Distributions of MUC1 and galectin-3 in various tumor and nonmalignant tissues. A and B, sections of paraffin-embedded human tumor (A) and nonmalignant (B) tissues (stomach, colon, breast, and pancreas) were stained with hematoxylin and eosin (H&E), DAPI (blue), and the same combinations of antibodies as described in Fig. 3 (MUC1-ND, green; galectin-3, red). Image magnification is ×200. Scale bars, 100 μm.
FIGURE 5.
FIGURE 5.
Enhanced phosphorylation of ERK1/2 and Akt through the binding of galectin-3 to MUC1. A, after galectin-3 retained on the cell surface had been excluded as described under “Experimental Procedures,” HCT116/MUC1 cells were treated with recombinant galectin-3 (40 μg/ml, rGal-3 +) or PBS (vehicle, rGal-3 −) for 4 min, and then MUC1 was immunoprecipitated (IP) from lysates of HCT116/MUC1 cells with anti-MUC1-ND antibodies. The immunoprecipitates were subjected to SDS-PAGE, followed by Western blotting and detection with biotin-conjugated anti-phosphotyrosine (pTyr) and anti-MUC1-CD antibodies. The arrowhead in the right panel indicates tyrosine-phosphorylated MUC1-CD. B, the intensities of the bands in Fig. 5A were determined with ImageJ. The ratio of tyrosine-phosphorylated MUC1-CD (pTyr) to MUC1-CD in galectin-3-treated HCT116/MUC1 cells was determined when that in non-galectin-3-treated HCT116/MUC1 cells was taken as 1 (means ± S.D., n = 3). *, p < 0.05. C–E, after exclusion of galectin-3 from the cell surface as described above, HCT116/Mock, HCT116/MUC1 (C), A549/Mock, A549/MUC1 (D), SKOV3/Scr and SKOV3/Si-1 (E) cells were treated with recombinant galectin-3 (40 μg/ml, rGal-3 +) or PBS (vehicle, rGal-3 −) for 10 min, and then the lysates were subjected to SDS-PAGE, followed by Western blotting and detection with anti-phospho-ERK1/2 (pERK1/2), anti-ERK1/2, anti-phospho-Akt (pAkt), and anti-Akt antibodies. F and G, the intensities of the bands in Fig. 5 (C–E) were determined with ImageJ. Each histogram shows the ratios of pERK1/2 to ERK1/2 (F) and pAkt to Akt (G) in each galectin-3-treated cell type when the ratios obtained from each non-galectin-3-treated cell type were taken as 1 (means ± S.D., n = 3). *, p < 0.05; **, p < 0.01.
FIGURE 6.
FIGURE 6.
Influence of an EGFR inhibitor on phosphorylation of ERK1/2 and Akt through the binding of galectin-3 to MUC1. A, after exclusion of galectin-3 from the cell surface as described in Fig. 5A, HCT116/MUC1 cells were preincubated with an EGFR inhibitor (10 μm) for 1 h and subsequently treated with recombinant galectin-3 (40 μg/ml, rGal-3 +) or PBS (vehicle, rGal-3 −) for 10 min. Phosphorylated ERK1/2, total ERK1/2, phosphorylated Akt, and total Akt were determined as described in Fig. 5 (C–E). Concomitantly, EGFR and β-actin were also determined. B and C, the intensities of the bands in Fig. 6A were determined as described in Fig. 5 (F and G). The ratios obtained from non-galectin-3-treated HCT116/MUC1 cells were taken as 1 (means ± S.D., n = 4). *, p < 0.05; **, p < 0.01.
FIGURE 7.
FIGURE 7.
Effect of galectin-3 multivalency on phosphorylation of ERK1/2 and Akt through the binding of galectin-3 to MUC1. A, galectin-3 treated with collagenase type VII (cleaved) or PBS (intact) as described under “Experimental Procedures” was subjected to SDS-PAGE, followed by Coomassie Brilliant Blue staining. B, after exclusion of galectin-3 from the cell surface and subsequent preincubation with the EGFR inhibitor as described in Fig. 6A, HCT116/MUC1 cells were treated with intact galectin-3, cleaved galectin-3 (40 μg/ml, respectively), or PBS (vehicle) for 10 min, and then phosphorylated ERK1/2, total ERK1/2, phosphorylated Akt, and total Akt were determined as described in Fig. 5 (C–E). C and D, the intensities of the bands in Fig. 7B were determined as described in Fig. 5 (F and G). The ratios obtained from PBS-treated HCT116/MUC1 cells were taken as 1 (means ± S.D., n = 3). **, p < 0.01.
FIGURE 8.
FIGURE 8.
Enhancement of cell proliferation of various MUC1-expressing cells. A–C, HCT116/Mock and HCT116/MUC1 (5 × 10³ cells) (A), A549/Mock and A549/MUC1 (2 × 10³ cells) (B), and SKOV3/Scr, SKOV3/Si-1, and SKOV3/Si-2 cells (2 × 10³ cells) (C) were plated and cultured for 24, 48, and 72 h. The level of cell proliferation was assessed by MTT assays (means ± S.D., n = 3). *, p < 0.05; **, p < 0.01. D, HCT116/Mock and HCT116/MUC1 cells (5 × 10³ cells) were plated and cultured for 2 weeks. The cells thereafter were fixed and stained with crystal violet as described under “Experimental Procedures.” E, the dye was extracted from the cells as described under “Experimental Procedures,” and its level was determined by measuring the absorbance at 590 nm (means ± S.D., n = 3). *, p < 0.05.
FIGURE 9.
FIGURE 9.
Enhancement of cell motility of various MUC1-expressing cells. A and B, a cell-free area as to HCT116/Mock, HCT116/MUC1 (A), SKOV3/Scr, SKOV3/Si-1, and SKOV3/Si-2 (B) cells was created with culture inserts as described under “Experimental Procedures,” and then the cells were cultured for 20 h (A) or 7 h (B) in the presence of hydroxyurea (10 mm). Images were taken immediately after removal of the culture inserts (0 h) and after the incubation times described above (20 or 7 h). Image magnification is ×100. Scale bars, 100 μm. C and D, the percentage of the cell-free area was expressed as the percentage of the cell-free area at 20 (C) or 7 h (D) when the cell-free area at 0 h was taken as 100% (means ± S.D., n = 3). *, p < 0.05; **, p < 0.01.
FIGURE 10.
FIGURE 10.
Effect of galectin-3 silencing on malignancy of MUC1-expressing cells. A, lysates of HCT116/MUC1-Scr and HCT116/MUC1-Gal-3/Si cells were subjected to SDS-PAGE, followed by Western blotting as described in Fig. 1C. β-Actin was used as a loading control. B, biotin-labeled MUC1-ND and galectin-3 on the surface of HCT116/MUC1-Scr and HCT116/MUC1-Gal-3/Si cells were detected as described in Fig. 2A. C, the level of galectin-3 on the cell surface was determined by measuring the intensities of the bands in Fig. 10B as described in Fig. 2B (means ± S.D., n = 3). **, p < 0.01. D, HCT116/MUC1-Scr and HCT116/MUC1-Gal-3/Si cells (1 × 10⁴ cells) were plated, and the proliferation level was determined as described in Fig. 8 (A–C) (means ± S.D., n = 3). **, p < 0.01. E and F, HCT116/MUC1-Scr and HCT116/MUC1-Gal-3/Si cells (5 × 10³ cells) were plated, and then anchorage-dependent cell proliferation was evaluated by measuring the absorbance as described in Fig. 8 (D and E) (means ± S.D., n = 3). *, p < 0.05. G and H, HCT116/MUC1-Scr and HCT116/MUC1-Gal-3/Si cells were precultured using culture inserts. After creating a gap, the cells were further incubated for 20 h under the same conditions as described in Fig. 9 (A and B). HCT116/MUC1-Gal-3/Si cells were also cultured in the presence of recombinant galectin-3 (rGal-3) (40 μg/ml), and their cell motilities were assessed as described above. The percentage of the cell-free area was calculated as described in Fig. 9 (C and D) (means ± S.D., n = 3). *, p < 0.05. Image magnification is ×100. Scale bars, 100 μm.
FIGURE 11.
FIGURE 11.
Inhibitory effects of galectin-3 antagonists on cell proliferation. A, schematic structures of artificial glycopolymers. m indicates the number of repetitive LacNAcs (m = 1–3), and n indicates the degree of polymerization of glutamic acid residues (n = 467). B, each glycopolymer (0.5 μm) was immobilized on a plate as described under “Experimental Procedures.” The binding affinity of galectin-3 for each glycopolymer was measured by plate assays (means ± S.D., n = 3). C, HCT116/Mock and HCT116/MUC1 cells (1 × 10⁴ cells) were cultured in medium containing 0.5% HI-FBS and each glycopolymer (0.1 μm) for 72 h. The effects of the glycopolymers on cell proliferation were determined by MTT assays. The absorbance observed for each (LacNAc)1-treated cell was taken as 100% (means ± S.D., n = 4). **, p < 0.01. (LacNAc)1, glycopolymer carrying a single LacNAc repeat; (LacNAc)2, glycopolymer carrying a tandem LacNAc repeat; (LacNAc)3, glycopolymer carrying a triplet LacNAc repeat.

References

    1. Kufe D., Inghirami G., Abe M., Hayes D., Justi-Wheeler H., and Schlom J. (1984) Differential reactivity of a novel monoclonal antibody (DF3) with human malignant versus benign breast tumors. Hybridoma 3, 223–232 - PubMed
    1. Kufe D. (2009) Mucins in cancer: function, prognosis and therapy. Nat. Rev. Cancer 9, 874–885 - PMC - PubMed
    1. Ligtenberg M. J., Kruijshaar L., Buijs F., van Meijer M., Litvinov S. V., and Hilkens J. (1992) Cell-associated episialin is a complex containing two proteins derived from a common precursor. J. Biol. Chem. 267, 6171–6177 - PubMed
    1. Parry S., Silverman H. S., McDermott K., Willis A., Hollingsworth M. A., and Harris A. (2001) Identification of MUC1 proteolytic cleavage sites in vivo. Biochem. Biophys. Res. Commun. 283, 715–720 - PubMed
    1. Siddiqui J., Abe M., Hayes D., Shani E., Yunis E., and Kufe D. (1988) Isolation and sequencing of a cDNA coding for the human DF3 breast carcinoma-associated antigen. Proc. Natl. Acad. Sci. U.S.A. 85, 2320–2323 - PMC - PubMed

Publication types