. 2015 Oct 23;290(43):25876-90.
doi: 10.1074/jbc.M115.678508. Epub 2015 Sep 4.

Mapping Key Residues of ISD11 Critical for NFS1-ISD11 Subcomplex Stability: IMPLICATIONS IN THE DEVELOPMENT OF MITOCHONDRIAL DISORDER, COXPD19

Affiliations

Mapping Key Residues of ISD11 Critical for NFS1-ISD11 Subcomplex Stability: IMPLICATIONS IN THE DEVELOPMENT OF MITOCHONDRIAL DISORDER, COXPD19

Prasenjit Prasad Saha et al. J Biol Chem. .

Abstract

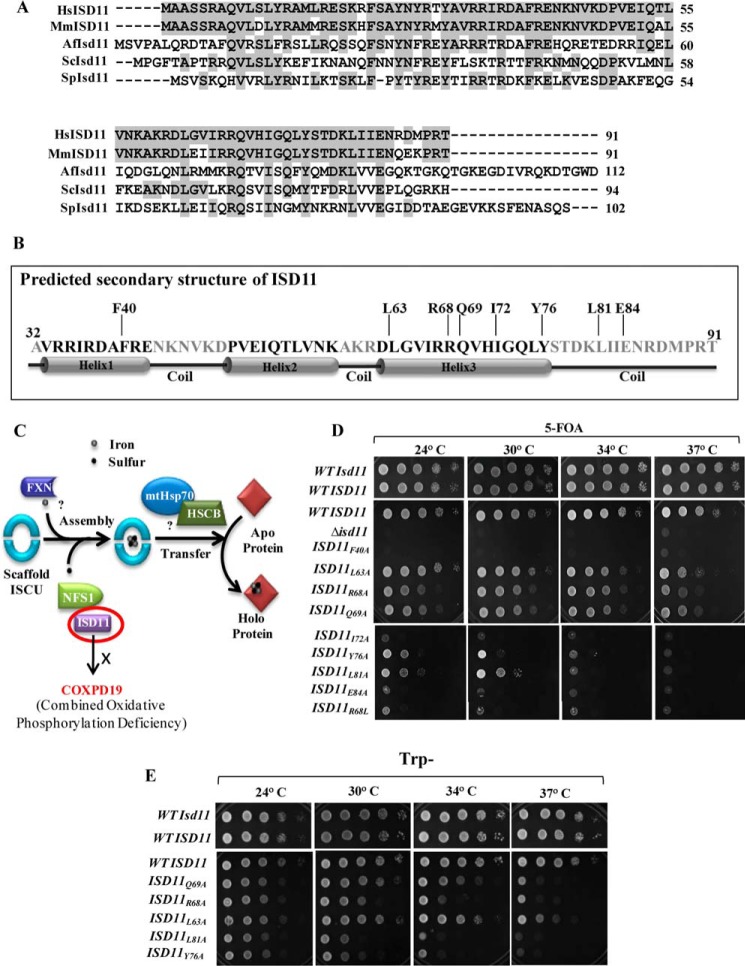
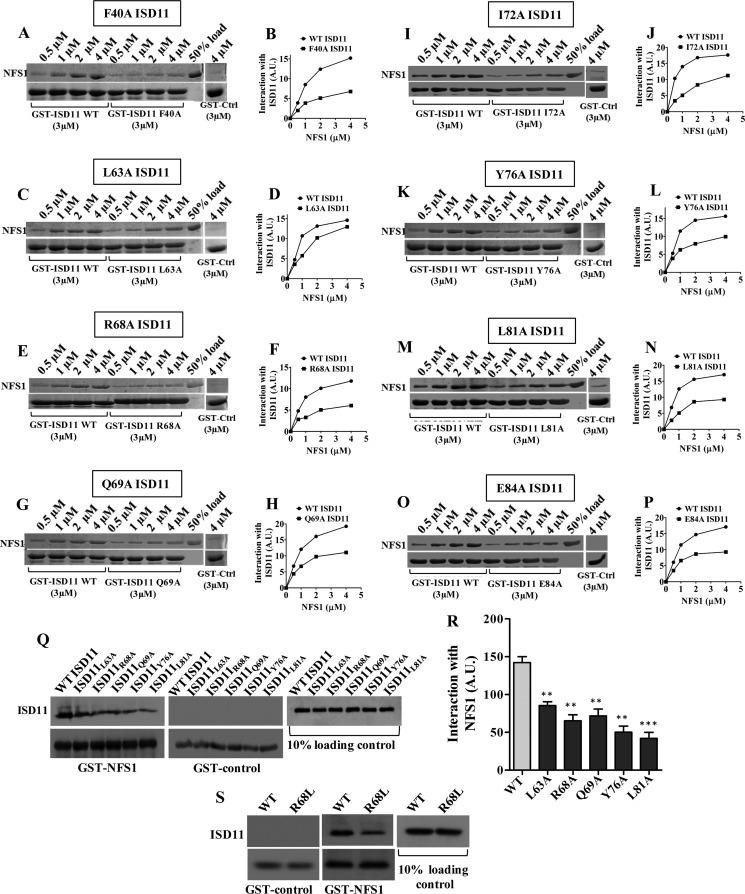
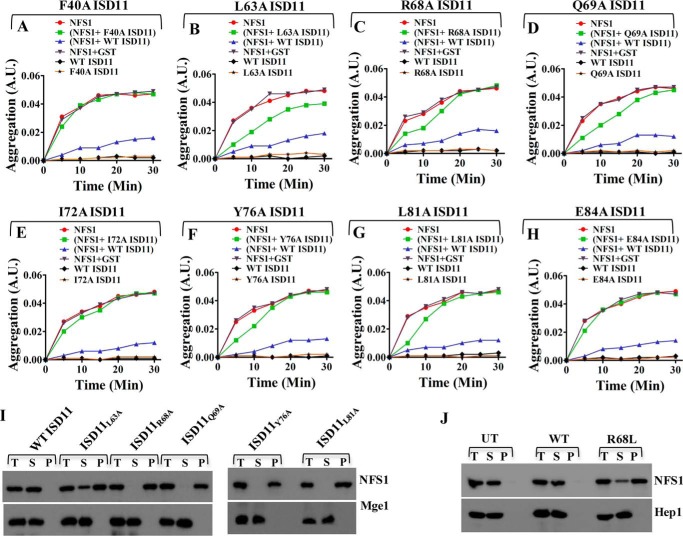
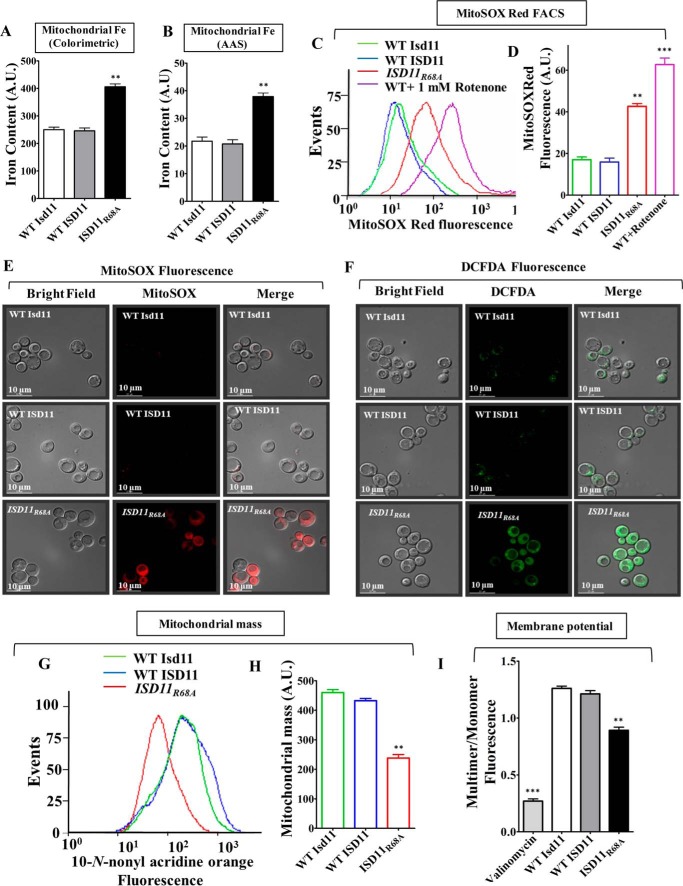
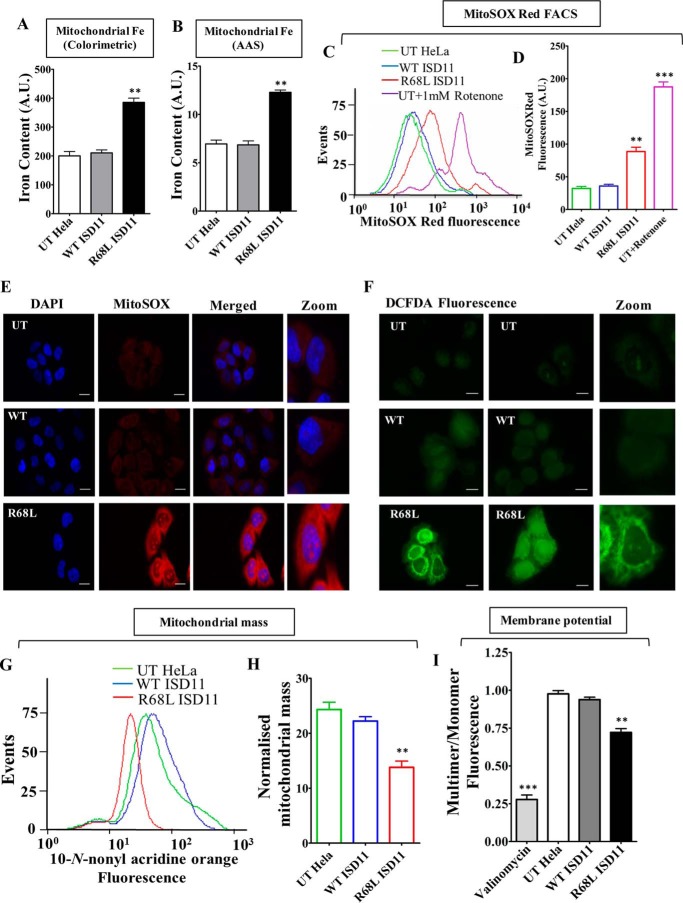
Biogenesis of the iron-sulfur (Fe-S) cluster is an indispensable process in living cells. In mammalian mitochondria, the initial step of the Fe-S cluster assembly process is assisted by the NFS1-ISD11 complex, which delivers sulfur to scaffold protein ISCU during Fe-S cluster synthesis. Although ISD11 is an essential protein, its cellular role in Fe-S cluster biogenesis is still not defined. Our study maps the important ISD11 amino acid residues belonging to putative helix 1 (Phe-40), helix 3 (Leu-63, Arg-68, Gln-69, Ile-72, Tyr-76), and C-terminal segment (Leu-81, Glu-84) are critical for in vivo Fe-S cluster biogenesis. Importantly, mutation of these conserved ISD11 residues into alanine leads to its compromised interaction with NFS1, resulting in reduced stability and enhanced aggregation of NFS1 in the mitochondria. Due to altered interaction with ISD11 mutants, the levels of NFS1 and Isu1 were significantly depleted, which affects Fe-S cluster biosynthesis, leading to reduced electron transport chain complex (ETC) activity and mitochondrial respiration. In humans, a clinically relevant ISD11 mutation (R68L) has been associated in the development of a mitochondrial genetic disorder, COXPD19. Our findings highlight that the ISD11 R68A/R68L mutation display reduced affinity to form a stable subcomplex with NFS1, and thereby fails to prevent NFS1 aggregation resulting in impairment of the Fe-S cluster biogenesis. The prime affected machinery is the ETC complex, which showed compromised redox properties, causing diminished mitochondrial respiration. Furthermore, the R68L ISD11 mutant displayed accumulation of mitochondrial iron and reactive oxygen species, leading to mitochondrial dysfunction, which correlates with the phenotype observed in COXPD19 patients.

Keywords: electron transfer; iron-sulfur protein; mitochondria; mitochondrial disease; molecular chaperone; protein-protein interaction; reactive oxygen species (ROS); respiration.


Figures

FIGURE 1.
FIGURE 1.
Multiple sequence alignment of ISD11 orthologs and effect of mutations on cell viability. A, multiple sequence alignment of ISD11 protein orthologs from different species: Homo sapiens (Hs), Mus musculus (Mm), Aspergillus fumigatus (Af), S. cerevisiae (Sc), and Schizosaccharomyces pombe (Sp) was performed using ClustalW multiple sequence alignment program. Identical residues are highlighted in gray. B, secondary structure of matured form of ISD11 (amino acids 32–91) was predicted using Robetta Full-chain Protein Structure Prediction Server, depicting three helices and position of critical amino acid residues along the length of the protein. C, a schematic representation of Fe-S cluster biogenesis indicating the essential steps. Sulfur donation is assisted by NFS1-ISD11 protein complex, whereas frataxin acts as the putative iron donor. ATP-dependent mtHsp70 chaperone GRP75 and co-chaperone HSCB with the help of other transfer factors aids in the incorporation of Fe-S clusters into recipient apoproteins. R68L point mutations in ISD11 lead to development of COXPD19. D, Δisd11 yeast strain carrying a yeast WT ISD11 in pRS316 plasmid was transformed with WT LYRM4 or LYRM4 mutants (F40A, Q63A, R68A, Q69A, I72A, Y76A, L81A, E84A, and R68L) in pRS414 vector under TEF promoter and subjected to drop test analysis on 5-FOA medium followed by incubation at the indicated temperatures for 72 h. E, Δisd11 yeast strain harboring a copy of WT LYRM4 or ts LYRM4 mutants (Q69A, R68A, L63A, L81A, and Y76A) in a centromeric plasmid pRS414 TEF were subjected to spot test analysis on Trp plates, followed by incubation for 72 h at the indicated temperatures. Δisd11 yeast strain carrying a WT ISD11 was taken as positive control.
FIGURE 2.
FIGURE 2.
Estimation of expression levels of proteins involved in Fe-S cluster biogenesis pathway. A, Δisd11 yeast strain carrying yeast WT ISD11 in pRS316 plasmid was transformed with human WT LYRM4 or LYRM4 mutants (F40A, Q63A, R68A, Q69A, I72A, Y76A, L81A, and E84A) in pRS414 TEF vector and subjected to immunodetection of FLAG-tagged ISD11. B, WT and ts mutants (L63A, R68A, Q69A, Y76A, and L81A) grown at permissive temperature were subjected to heat shock at 37 °C, followed by mitochondria isolation. The mitochondrial lysates were separated on SDS-PAGE and subjected to Western blot analysis to compare protein levels of Nfs1, ISD11, Isu1, and Jac1. Mitochondrial matrix protein Mge1 was taken as loading control. C–G, relative protein levels of Nfs1 (C), Isu1 (D), ISD11 (E), Jac1 (F), and Mge1 (G) from WT and ts mutants were quantified by densitometry. Data represented as mean ± S.E. The values were plotted based on three independent experiments (n = 3). p value of <0.05 was defined as significant, and asterisks are used to denote significance, where: *, p < 0.05; **, p < 0.01; ***, p < 0.001. A.U., arbitrary unit.
FIGURE 3.
FIGURE 3.
Interaction analysis of NFS1 with ISD11 mutants. A-P, glutathione-Sepharose bound WT GST-ISD11 (3 μm) or mutant GST-ISD11 (3 μm) was incubated with increasing concentrations of purified NFS1, as indicated. The unbound proteins were washed and analyzed by SDS-PAGE followed by Coomassie staining. GST alone (3 μm) was used as a negative control, and 50% input of NFS1 was taken as a loading control. The band intensities of bound NFS1 were analyzed by densitometry using ImageJ software. Interaction of NFS1 with WT ISD11 and F40A ISD11 (A and B), L63A ISD11 (C and D), R68A ISD11 (E and F), Q69A ISD11 (G and H), I72A ISD11 (I and J), Y76A ISD11 (K and L), L81A ISD11 (M and N), and E84A ISD11 (O and P) are represented. Q and R, interaction analysis of NFS1 with ts mutants in mitochondrial lysates. Mitochondria isolated from WT and ts mutant strains (Q69A, R68A, L63A, L81A, and Y76A) were subjected to lysis and the supernatant fractions were incubated with GST-NFS1 (2 μm). Unbound proteins were washed, and FLAG-tagged ISD11 was detected by Western blotting using the anti-FLAG antibodies. GST alone was taken as negative control and ISD11 as loading control (Q). The band intensities shown in Q were analyzed by densitometry using ImageJ software (R). S, mitochondria isolated from WT or R68L ISD11 expressing HeLa cells were lysed, and the supernatant fractions were incubated with GST-NFS1 (2 μm). Unbound proteins were removed by washing, followed by SDS-PAGE and immunostaining using an anti-FLAG antibody to detect the FLAG-tagged ISD11. GST alone was taken as negative control and ISD11 as loading control. Data are represented as mean ± S.E. The values were obtained from three independent experiments (n = 3). p value of <0.05 was defined as significant, and asterisks are used to denote significance, where: *, p < 0.05; **, p < 0.01; ***, p < 0.001. A.U., arbitrary unit.
FIGURE 4.
FIGURE 4.
Effect of ISD11 mutations in preventing aggregation of NFS1. A-H, aggregation of NFS1 was monitoring by measuring absorbance of NFS1 (1 μm) at different time intervals time at 320 nm at 37 °C. Red lines indicate aggregation of NFS1 (1 μm) alone. Aggregation of WT GST-ISD11 (2 μm) alone is indicated in black lines. Aggregation of NFS1 (1 μm) in presence of WT GST-ISD11 (2 μm) showed in purple lines. Gray lines indicate aggregation of NFS1 in the presence of 1 μm GST as a control. Green lines depict aggregation of NFS1 (1 μm) in presence of 2 μm of F40A GST-ISD11 (A) or L63A GST-ISD11 (B) or R68A GST-ISD11 (C) or Q69A GST-ISD11 (D) or I72A GST-ISD11 (E) or Y76A GST-ISD11 (F) or L81A GST-ISD11 (G) or E84A GST-ISD11 (H). Yellow lines are used to indicate aggregation of mutants alone as controls. I, in vivo aggregation analysis of NFS1 in WT and ts mutants (Q69A, R68A, L63A, L81A, and Y76A). Mitochondria isolated from WT and ts mutants were subjected to heat shock at 37 °C, followed by lysis and separation of pellet and supernatant fractions. Total (T), supernatant (S), and pellet (P) fractions were immunoprobed using NFS1-specific antibody. Mitochondrial matrix protein Mge1 was taken as soluble protein control. J, to analyze aggregation of NFS1 in HeLa cells, a similar experiment was performed in mitochondria isolated from UT (untransfected) HeLa cells and HeLa cells expressing WT and R68L ISD11. Total (T), supernatant (S), and pellet (P) fractions were probed for NFS1 through Western blotting. Mitochondrial matrix protein Hep1 was taken as soluble protein control. A.U., absorbance unit.
FIGURE 5.
FIGURE 5.
Measurement of Fe-S cluster containing enzymes activity and respiration efficiency in ts mutants and in R68L HeLa cells. A represents activity of ETC complex II in WT and ts mutants (Q69A, R68A, L63A, L81A, and Y76A). B, representation of enzymatic activity of aconitase in mitochondria isolated from WT and ts mutant strains. C, mitochondrial levels of Fe-S cluster proteins aconitase (Aco1) and Rieske Fe-S protein in WT ISD11 and ts mutants were analyzed by Western blotting using indicated specific antibodies. Mitochondrial matrix protein Mge1 was taken as loading control. D, the level of mitochondrial ATP was measured using the mitochondrial ToxGlo assay kit in WT and ts mutant mitochondria. E, the expression level of mitochondrial aconitase (Aco2) and Rieske Fe-S protein in WT and R68L HeLa cells was analyzed by SDS-PAGE and immunodecoration with antibodies against the indicated proteins. Mitochondrial protein Tim23 was taken as loading control. F, activity of ETC complex I was measured in isolated mitochondria obtained from untransfected (UT) or WT and R68L expressing HeLa cells. The reactions were performed in the presence or absence of complex I inhibitor rotenone to check the specificity. G, representation of ETC complex II activity in the presence of an inhibitor of complex I, III, and IV in HeLa cell mitochondria. H, measurement of activity of TCA cycle enzyme, aconitase in the mitochondrial lysate from HeLa cells. I, mitochondrial ATP was measured in HeLa cells using the Mitochondrial ToxGlo assay kit. Data are represented as mean ± S.E. The values were obtained from three independent experiments (n = 3). p value of <0.05 was defined as significant, and asterisks are used to denote significance, where: *, p < 0.05; **, p < 0.01; ***, p < 0.001. A.U., arbitrary unit.
FIGURE 6.
FIGURE 6.
Analysis of mitochondrial iron, ROS levels and mitochondrial function in COXPD19 related ISD11R68A mutant. A and B, representation of iron levels in yeast mitochondria expressing WT Isd11 or WT ISD11 or ISD11R68A, measured by iron-specific colorimetric assay (A) and AAS (B). C and D, mitochondrial superoxide levels in WT and ISD11R68A yeast strains were estimated using MitoSOX Red dye by flow cytometry and represented in the overlaying histograms (C) and mean fluorescence intensity obtained by flow cytometry was quantitated (D). WT Isd11 cells treated with 1 mm rotenone was utilized as positive control. E, yeast strains were treated with MitoSOX Red dye (red fluorescence) and subjected to microscopic analysis using DeltaVision Fluorescence Microscope (×100 objective). Left column, bright field; middle column, MitoSOX red fluorescence; and right column, merged. F, overall cellular peroxide levels were measured by staining using H2DCFDA dye (green fluorescence), followed by fluorescence microscopy analysis using Delta Vision Fluorescence Microscope (×100 objective). Left, bright field; middle, H2DCFDA fluorescence, and right columns, merged. G and H, mitochondrial mass in yeast strains expressing WT Isd11 or WT ISD11 or ISD11R68A was assessed using NAO dye. The fluorescence was measured through flow cytometry and represented as histogram (G) or mean fluorescence intensity (MFI) obtained in flow cytomety was quantitated and represented as bar diagram (H). I, JC-1 staining was used for the estimation of mitochondrial membrane potential in yeasts strains. An emission scan from the 500 to 620 nm wavelength was performed in JC-1-stained yeast cells and the multimer (590 nm) to monomer (530 nm) ratio was quantified and represented. Mitochondria treated with valinomycin were used as a positive control. Data represented as mean ± S.E. The values were obtained from three independent experiments (n = 3). p value of <0.05 was defined as significant, and asterisks are used to denote significance, where: *, p < 0.05; **, p < 0.01; ***, p < 0.001. Scale bar, 10 μm. A.U., arbitrary unit.
FIGURE 7.
FIGURE 7.
Estimation of mitochondrial iron content, ROS levels, and evaluation of mitochondrial functionality in R68L ISD11 mutant. A and B, mitochondrial iron level was estimated in untranslated (UT), WT, and R68L HeLa cells using iron specific colorimetric assay (A) and AAS (B). C, flow cytometry analysis to measure the mitochondrial superoxide level in HeLa cells using MitoSOX Red staining. D, representation of mean fluorescence intensity of MitoSOX Red fluorescence in UT, WT, and R68L HeLa cells. The UT cells treated with 1 mm rotenone were used as a positive control. E, untransfected HeLa cells (UT) or cells expressing WT or R68L mutant proteins were stained with MitoSOX Red dye. The fluorescence was analyzed using Zeiss Apotome fluorescence microscope using ×63 objective lens (scale bar: 10 μm). F, to measure the overall cellular ROS level, fluorescence images of HeLa cells stained with H2DCFDA dye (green fluorescence) were obtained from Zeiss Apotome fluorescence microscope using ×63 objective lens (scale bar: 10 μm). G and H, mitochondrial mass was estimated by staining HeLa cells with NAO dye. The total MFI values obtained from flow cytometric analyses of NAO staining are presented as histogram (G) and mean fluorescence values obtained in the flow cytometry were quantitated (H). I, mitochondria isolated from HeLa cells was stained with the JC-1 dye to measure the mitochondrial membrane potential. The emission spectrum was scanned from wavelength 500 to 620 nm, and the ratio between JC-1 multimer (590 nm) and JC-1 monomer (530 nm) was represented. Data are represented as mean ± S.E. The values were obtained from three independent experiments (n = 3). p value of <0.05 was defined as significant, and asterisks are used to denote significance, where: *, p < 0.05; **, p < 0.01; ***, p < 0.001. A.U., arbitrary unit.

Similar articles

Cited by

References

    1. Craig E. A., and Marszalek J. (2002) A specialized mitochondrial molecular chaperone system: a role in formation of Fe/S centers. Cell Mol. Life Sci. 59, 1658–1665 - PMC - PubMed
    1. Craig E. A., Voisine C., and Schilke B. (1999) Mitochondrial iron metabolism in the yeast Saccharomyces cerevisiae. Biol. Chem. 380, 1167–1173 - PubMed
    1. Meyer J. (2008) Iron-sulfur protein folds, iron-sulfur chemistry, and evolution. J. Biol. Inorg. Chem. 13, 157–170 - PubMed
    1. Lill R., Dutkiewicz R., Elsässer H. P., Hausmann A., Netz D. J., Pierik A. J., Stehling O., Urzica E., and Mühlenhoff U. (2006) Mechanisms of iron-sulfur protein maturation in mitochondria, cytosol and nucleus of eukaryotes. Biochim. Biophys. Acta 1763, 652–667 - PubMed
    1. Beinert H., Holm R. H., and Münck E. (1997) Iron-sulfur clusters: nature's modular, multipurpose structures. Science 277, 653–659 - PubMed

Publication types

MeSH terms