

Statistical identifiability and sample size calculations for serial seroepidemiology
- PMID: 26342240
- PMCID: PMC4558460
- DOI: 10.1016/j.epidem.2015.02.005
Statistical identifiability and sample size calculations for serial seroepidemiology
Abstract
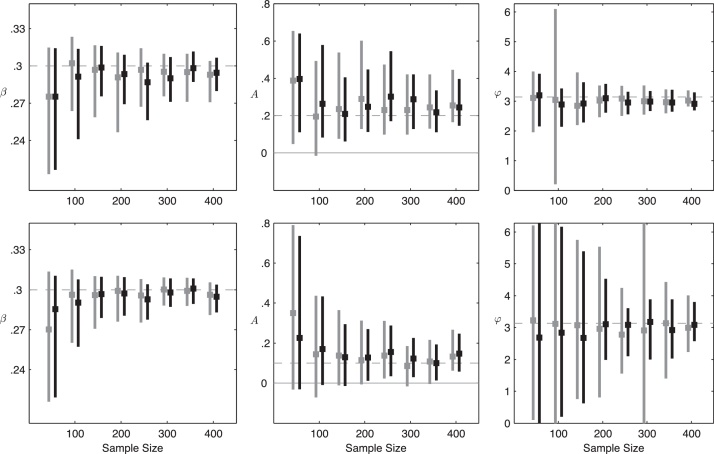
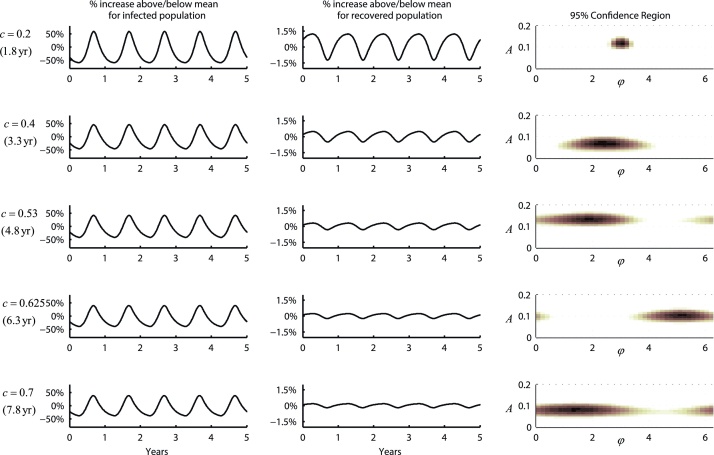
Inference on disease dynamics is typically performed using case reporting time series of symptomatic disease. The inferred dynamics will vary depending on the reporting patterns and surveillance system for the disease in question, and the inference will miss mild or underreported epidemics. To eliminate the variation introduced by differing reporting patterns and to capture asymptomatic or subclinical infection, inferential methods can be applied to serological data sets instead of case reporting data. To reconstruct complete disease dynamics, one would need to collect a serological time series. In the statistical analysis presented here, we consider a particular kind of serological time series with repeated, periodic collections of population-representative serum. We refer to this study design as a serial seroepidemiology (SSE) design, and we base the analysis on our epidemiological knowledge of influenza. We consider a study duration of three to four years, during which a single antigenic type of influenza would be circulating, and we evaluate our ability to reconstruct disease dynamics based on serological data alone. We show that the processes of reinfection, antibody generation, and antibody waning confound each other and are not always statistically identifiable, especially when dynamics resemble a non-oscillating endemic equilibrium behavior. We introduce some constraints to partially resolve this confounding, and we show that transmission rates and basic reproduction numbers can be accurately estimated in SSE study designs. Seasonal forcing is more difficult to identify as serology-based studies only detect oscillations in antibody titers of recovered individuals, and these oscillations are typically weaker than those observed for infected individuals. To accurately estimate the magnitude and timing of seasonal forcing, serum samples should be collected every two months and 200 or more samples should be included in each collection; this sample size estimate is sensitive to the antibody waning rate and the assumed level of seasonal forcing.
Keywords: Antibody waning; Complete disease dynamics; Influenza; Maximum likelihood; Serial seroepidemiology; Seroepidemiology; Statistical identifiability.
Copyright © 2015 The Authors. Published by Elsevier B.V. All rights reserved.
Figures
Similar articles
-
Assessment of baseline age-specific antibody prevalence and incidence of infection to novel influenza A/H1N1 2009.Health Technol Assess. 2010 Dec;14(55):115-92. doi: 10.3310/hta14550-03. Health Technol Assess. 2010. PMID: 21208549
-
Dynamics of shigellosis epidemics: estimating individual-level transmission and reporting rates from national epidemiologic data sets.Am J Epidemiol. 2013 Oct 15;178(8):1319-26. doi: 10.1093/aje/kwt122. Epub 2013 Sep 5. Am J Epidemiol. 2013. PMID: 24008913
-
Seroepidemiology: an underused tool for designing and monitoring vaccination programmes in low- and middle-income countries.Trop Med Int Health. 2016 Sep;21(9):1086-98. doi: 10.1111/tmi.12737. Epub 2016 Jul 1. Trop Med Int Health. 2016. PMID: 27300255 Review.
-
Dynamics of epidemic models with asymptomatic infection and seasonal succession.Math Biosci Eng. 2017 Oct/Dec 1;14(5-6):1407-1424. doi: 10.3934/mbe.2017073. Math Biosci Eng. 2017. PMID: 29161868
-
Serodynamics: A primer and synthetic review of methods for epidemiological inference using serological data.Epidemics. 2024 Dec;49:100806. doi: 10.1016/j.epidem.2024.100806. Epub 2024 Nov 30. Epidemics. 2024. PMID: 39647462 Free PMC article. Review.
Cited by
-
Mathematical models used to inform study design or surveillance systems in infectious diseases: a systematic review.BMC Infect Dis. 2017 Dec 18;17(1):775. doi: 10.1186/s12879-017-2874-y. BMC Infect Dis. 2017. PMID: 29254504 Free PMC article.
-
Prevalence and predictors of anti-SARS-CoV-2 serology in a highly vulnerable population of Rio de Janeiro: A population-based serosurvey.Lancet Reg Health Am. 2022 Nov;15:100338. doi: 10.1016/j.lana.2022.100338. Epub 2022 Jul 30. Lancet Reg Health Am. 2022. PMID: 35936224 Free PMC article.
-
Sample size calculation for estimating key epidemiological parameters using serological data and mathematical modelling.BMC Med Res Methodol. 2019 Mar 7;19(1):51. doi: 10.1186/s12874-019-0692-1. BMC Med Res Methodol. 2019. PMID: 30845904 Free PMC article.
-
Structure of general-population antibody titer distributions to influenza A virus.Sci Rep. 2017 Jul 20;7(1):6060. doi: 10.1038/s41598-017-06177-0. Sci Rep. 2017. PMID: 28729702 Free PMC article.
-
serosim: An R package for simulating serological data arising from vaccination, epidemiological and antibody kinetics processes.PLoS Comput Biol. 2023 Aug 14;19(8):e1011384. doi: 10.1371/journal.pcbi.1011384. eCollection 2023 Aug. PLoS Comput Biol. 2023. PMID: 37578985 Free PMC article.
References
-
- Baas D.C., Koopmans M.P., Bruin E.D., Hulscher H.I., Buisman A.M., Hendrikx L.H., Beek J.V., Godeke G.-j., Reimerink J., Binnendijk R.S.V. Detection of influenza A virus homo- and heterosubtype-specific memory B-cells using a novel protein microarray-based analysis tool. J. Med. Virol. 2013;85:899–909. - PubMed
-
- Bahl J., Nelson M.I., Chan K.H., Chen R., Vijaykrishna D., Halpin R.a., Stockwell T.B., Lin X., Wentworth D.E., Ghedin E., Guan Y., Malik Peiris J.S., Riley S., Rambaut A., Holmes E.C., Smith G.J.D. Temporally structured metapopulation dynamics and persistence of influenza A H3N2 virus in humans. Proc. Natl. Acad. Sci. U. S. A. 2011;108:19359–19364. - PMC - PubMed
Publication types
MeSH terms
Substances
Grants and funding
LinkOut - more resources
Full Text Sources
Other Literature Sources
