

Effects of population density on corticosterone levels of prairie voles in the field
- PMID: 26342968
- PMCID: PMC4684476
- DOI: 10.1016/j.ygcen.2015.09.002
Effects of population density on corticosterone levels of prairie voles in the field
Abstract
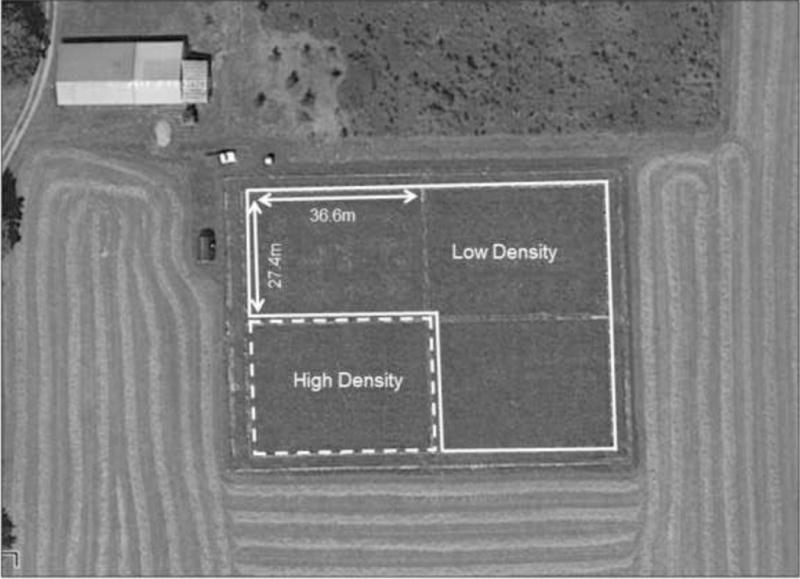
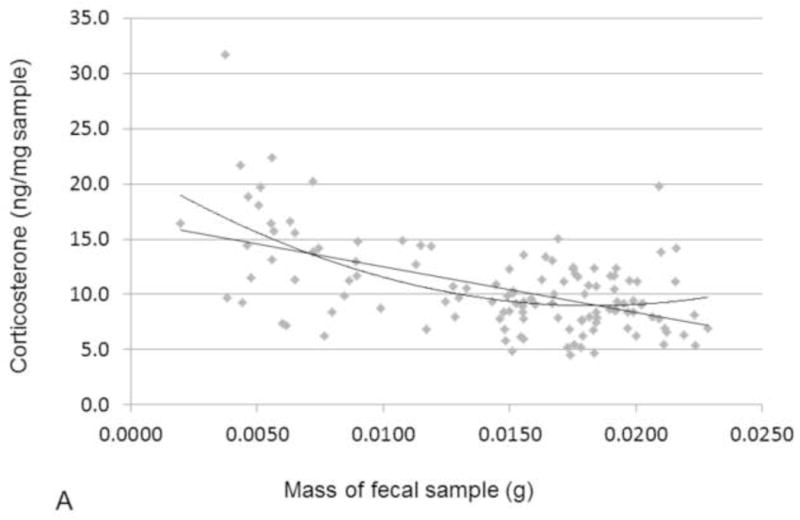
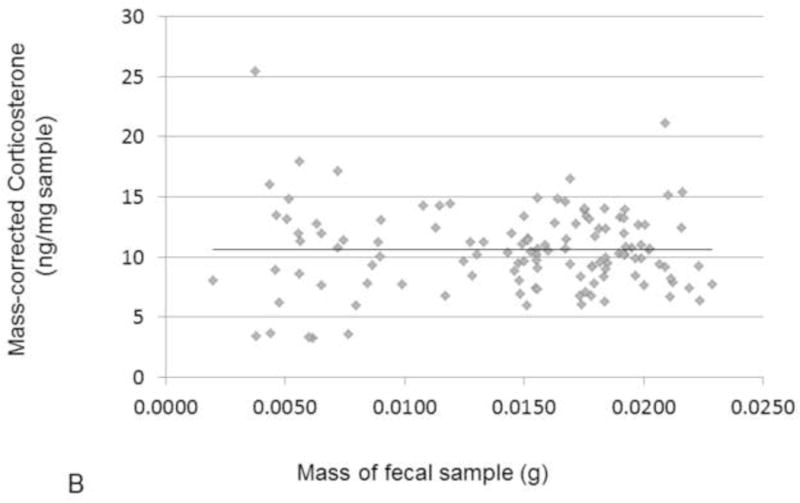
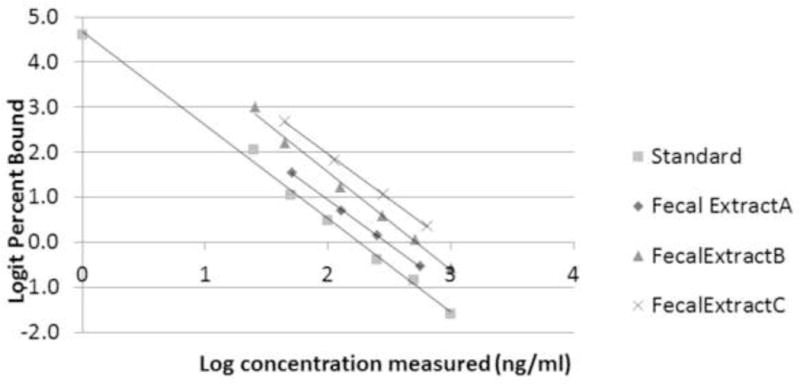
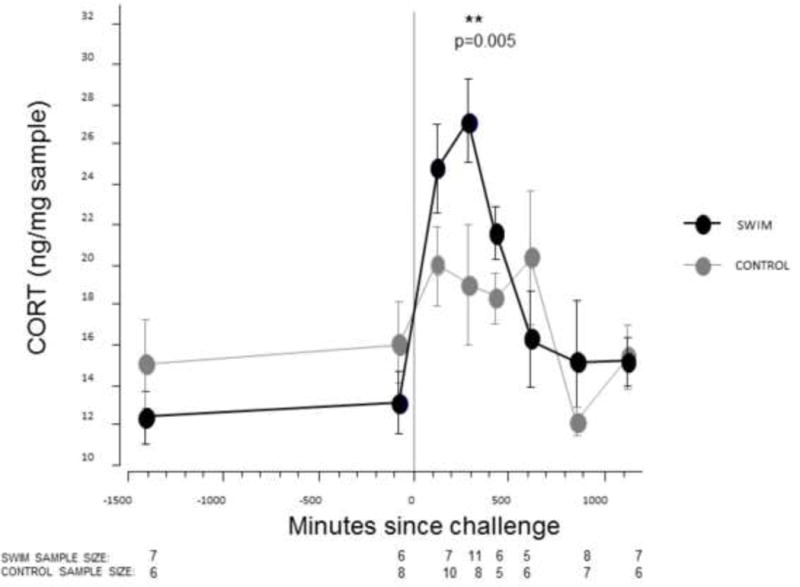
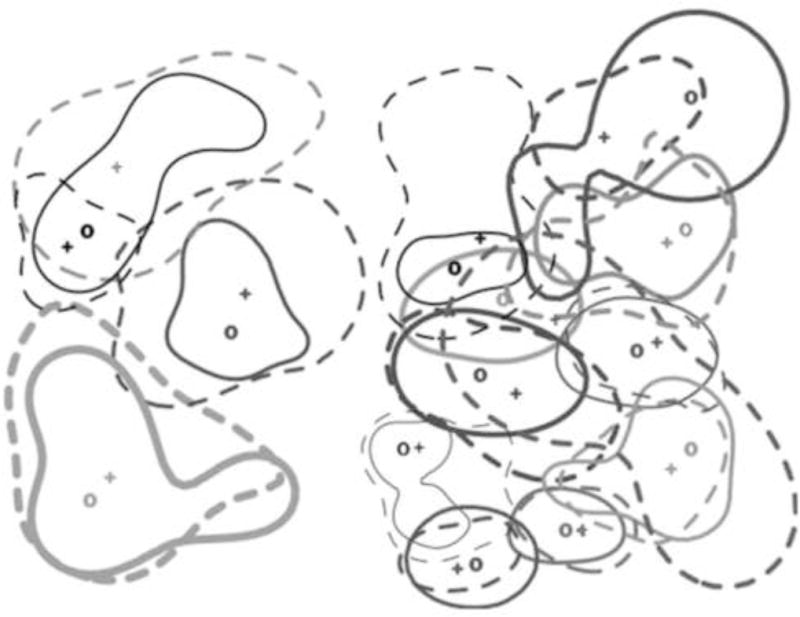
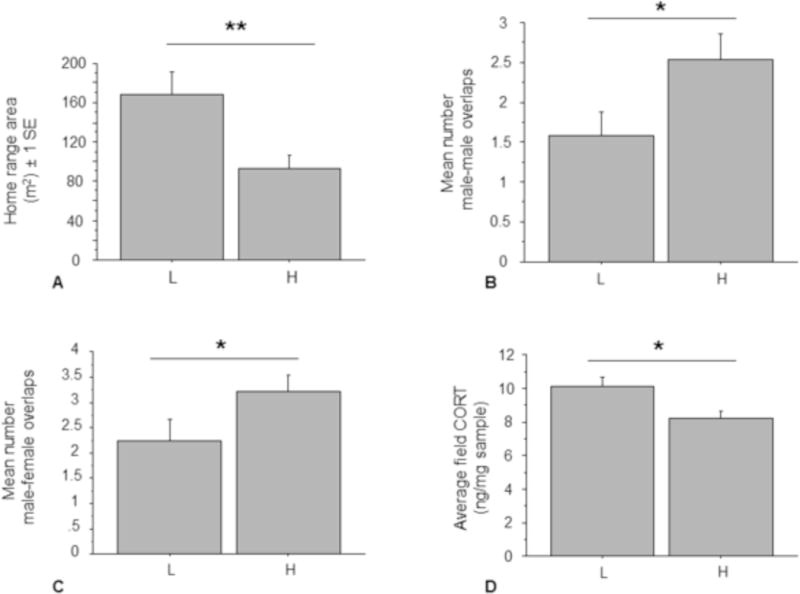
High population density is often associated with increased levels of stress-related hormones, such as corticosterone (CORT). Prairie voles (Microtus ochrogaster) are a socially monogamous species known for their large population density fluctuations in the wild. Although CORT influences the social behavior of prairie voles in the lab, the effect of population density on CORT has not previously been quantified in this species in the field. We validated a non-invasive hormone assay for measuring CORT metabolites in prairie vole feces. We then used semi-natural enclosures to experimentally manipulate population density, and measured density effects on male space use and fecal CORT levels. Our enclosures generated patterns of space use and social interaction that were consistent with previous prairie vole field studies. Contrary to the positive relationship between CORT and density typical of other taxa, we found that lower population densities (80 animals/ha) produced higher fecal CORT than higher densities (240/ha). Combined with prior work in the lab and field, the data suggest that high prairie vole population densities indicate favorable environments, perhaps through reduced predation risk. Lastly, we found that field animals had lower fecal CORT levels than laboratory-living animals. The data emphasize the usefulness of prairie voles as models for integrating ecological, evolutionary, and mechanistic questions in social behavior.
Keywords: Corticosterone; Fecal hormone assay; Microtus ochrogaster; Population density; Prairie vole; Stress.
Copyright © 2015 Elsevier Inc. All rights reserved.
Figures
Similar articles
-
Effects of acute corticosterone treatment on male prairie voles (Microtus ochrogaster): Territorial aggression does not accompany induced social preference.J Comp Psychol. 2016 Nov;130(4):400-406. doi: 10.1037/com0000048. J Comp Psychol. 2016. PMID: 27841456 Free PMC article.
-
Infant's response to social separation reflects adult differences in affiliative behavior: a comparative developmental study in prairie and montane voles.Dev Psychobiol. 1990 Jul;23(5):375-93. doi: 10.1002/dev.420230502. Dev Psychobiol. 1990. PMID: 2253816
-
Comparative analysis of gonadal hormone receptor expression in the postnatal house mouse, meadow vole, and prairie vole brain.Horm Behav. 2024 Feb;158:105463. doi: 10.1016/j.yhbeh.2023.105463. Epub 2023 Nov 22. Horm Behav. 2024. PMID: 37995608 Free PMC article.
-
The prairie vole (Microtus ochrogaster): an animal model for behavioral neuroendocrine research on pair bonding.ILAR J. 2004;45(1):35-45. doi: 10.1093/ilar.45.1.35. ILAR J. 2004. PMID: 14752206 Review.
-
Neuropeptide Regulation of Social Attachment: The Prairie Vole Model.Compr Physiol. 2016 Dec 6;7(1):81-104. doi: 10.1002/cphy.c150055. Compr Physiol. 2016. PMID: 28135000 Free PMC article. Review.
Cited by
-
Stress in the social context: a behavioural and eco-evolutionary perspective.J Exp Biol. 2023 Aug 1;226(15):jeb245829. doi: 10.1242/jeb.245829. Epub 2023 Aug 2. J Exp Biol. 2023. PMID: 37529973 Free PMC article. Review.
-
Physical separation from the mate diminishes male's attentiveness towards other females: a study in monogamous prairie voles Microtus ochrogaster.Curr Zool. 2017 Oct;63(5):537-544. doi: 10.1093/cz/zow087. Epub 2016 Aug 13. Curr Zool. 2017. PMID: 29492013 Free PMC article.
-
Solitude and serotonin: juvenile isolation alters the covariation between social behavior and cFos expression by serotonergic neurons.Front Neurosci. 2024 Oct 22;18:1446866. doi: 10.3389/fnins.2024.1446866. eCollection 2024. Front Neurosci. 2024. PMID: 39502712 Free PMC article.
-
Is chronic stress a causal mechanism for small mammal population cycles? Reconciling the evidence.Oecologia. 2023 Mar;201(3):609-623. doi: 10.1007/s00442-023-05338-5. Epub 2023 Mar 2. Oecologia. 2023. PMID: 36864247
-
Relaxing life of the city? Allostatic load in yellow-bellied marmots along a rural-urban continuum.Conserv Physiol. 2018 Dec 20;6(1):coy070. doi: 10.1093/conphys/coy070. eCollection 2018. Conserv Physiol. 2018. PMID: 30591838 Free PMC article.
References
-
- Adkins-Regan E. Hormones and Animal Social Behavior. Princeton University Press; Princeton: 2005.
-
- Allee WC. Animal aggregations, a study in general sociology. The University of Chicago Press; Chicago: 1931.
-
- Bales KL, Kramer KM, Lewis-Reese AD, Carter CS. Effects of stress on parental care are sexually dimorphic in prairie voles. Physiology & Behavior. 2006;87:424–429. - PubMed
-
- Batzli GO. Nutrition. In: Tamarin RH, editor. Biology of New World Microtus. American Society of Mammalogists; Stillwater, Oklahoma: 1985. pp. 779–811.
-
- Becker JB, Breedlove SM, Crews D, McCarthy MM. Behavioral endocrinology. Second. The MIT Press; Cambridge Massachusetts: 2002.
Publication types
MeSH terms
Substances
Grants and funding
LinkOut - more resources
Full Text Sources
Other Literature Sources
Miscellaneous
